
 NEAR Protocol
 Pyth Network
 Uniswap
 Pearl
Pearl Quantus
 Aerodrome Finance
 Starknet
- The Shell price is currently trading at $60.68.
- The price is forming an Ascending triangle pattern.
Shell Plc, founded in February 1907, is a prominent oil and gas exploration and production company. The company is engaged in the extraction of oil and gas from various sources, including fields, tight rocks, shale, and coal formations. It operates within the oil and gas manufacturing industry.
Shel Plc (SHEL) Stock: Financial Analysis
Shell’s revenue report has demonstrated strong growth over the past three years, spanning from 2020 to 2022, achieving an overall increase of 1.11%.
Looking ahead to the company’s 2023 revenue report, an estimated growth of 341.83 billion is anticipated. Analyzing the growth trend in the previous three years’ revenue reports indicates that Shell is well-positioned to meet the projected revenue for 2023.
From 2016 to 2019, Shell consistently maintained a dividend payout ratio of over 50%, indicating its financial well-being. However, in 2020, the company chose not to distribute dividends, likely reinvesting profits for growth. Subsequently, in 2021 and 2022, Shell provided dividends of 30.72 and 18.02, respectively.
Shel Plc (SHEL) Stock: Technical Analysis
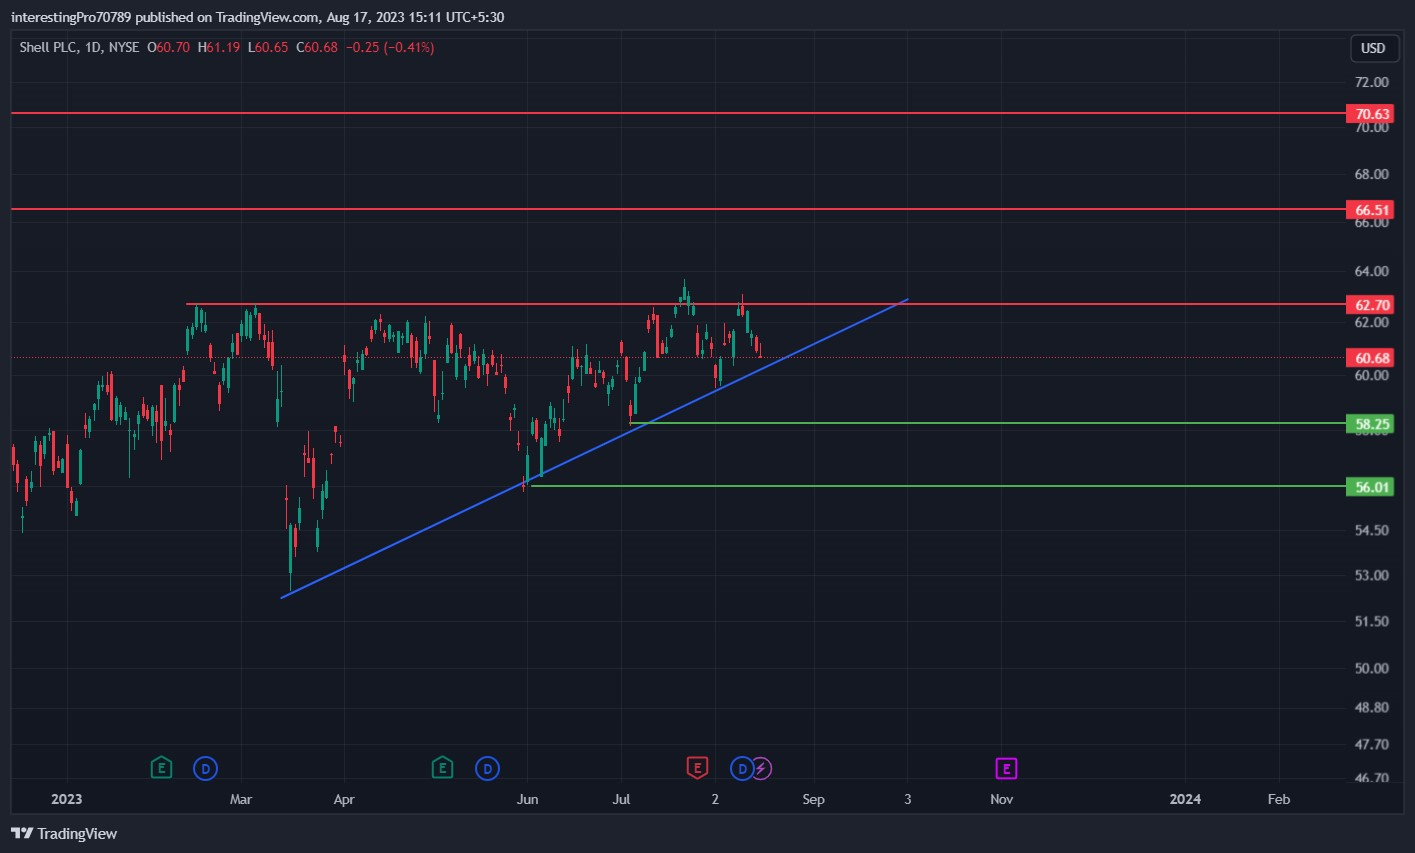
In March 2023, Shell’s stock price established support along a trendline, initiating a bullish rally towards the $62.70 resistance level. Upon reaching $60.72, Shell Stock price encountered resistance, resulting in a decline. However, the price found support again from the trendline.
Subsequently, Shell Stock price embarked on another bullish rally, managing to close above the $62.70 resistance. Nevertheless, the price was promptly rejected from this level, leading to a decline and a return to the trendline. This sequence of price movements formed an Ascending Triangle pattern, which is typically indicative of a bullish trend.
At present, the price is trading within the confines of the Ascending Triangle pattern. Since March 2023, Shell Stock price has exhibited a bullish momentum. If the price successfully breaks out above the $62.70 resistance with significant trading volume and maintains its position above it, the bullish trend is likely to persist. This could drive the price towards its subsequent resistance levels at $66.51 and $70.63.
However, in the event that Shell Stock price fails to breach the $62.70 resistance, facing rejection and subsequently breaking down through the trendline, a bearish momentum may develop. This could lead the price to target its support levels at $58.25 and $56.01.
Technical Indicators’ Prediction About the Current Trend.
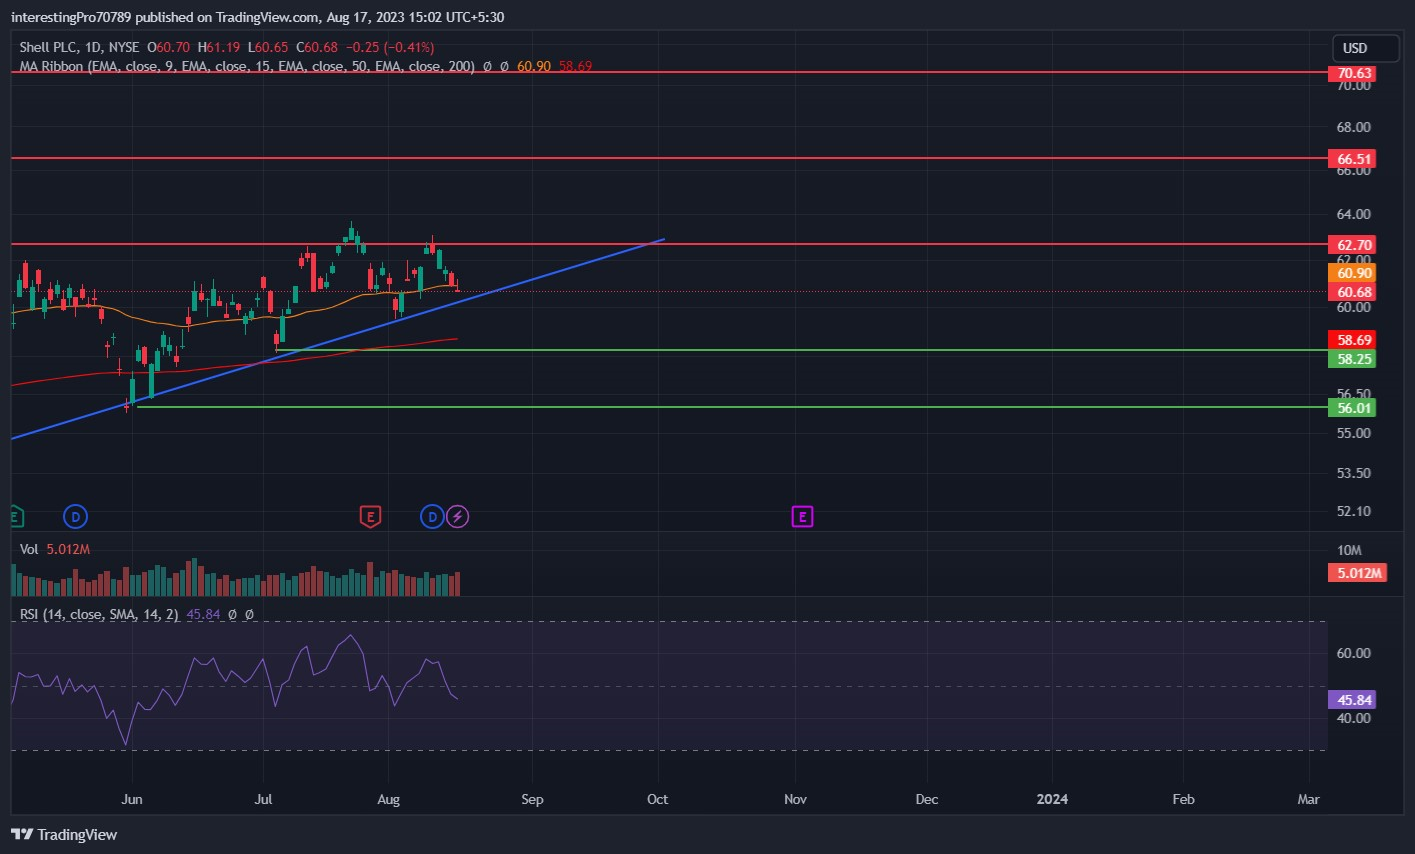
The 50 EMA (yellow line) is at $60.90 and the 200 EMA (red line) is at $58.69. The stock price is currently below the 50 EMA, which indicates bearish momentum and the price is trading above the 200 EMA, which indicates bullish momentum. This shows that the price is currently in an indecisive state.
The relative strength index (RSI) is at 45.84. The RSI is indicating that the price is in neutral territory, facing pressure from both buyers and sellers.
Conclusion
The chart of Shell Plc indicates a bullish trend as it forms an ascending triangle pattern. A potential breakout above the $60.72 resistance level could lead to a significant price movement. However, if Shell Stock price were to break below the trendline support, a bearish momentum might take hold. Currently, the technical indicators are showing a neutral stance.
Technical levels
Resistance levels: $62.70, $66.51 and $70.63
Support levels: $58.25 and $56.01.
Disclaimer
The views and opinions stated by the author, or any people named in this article, are for informational purposes only. They do not establish financial, investment, or other advice. Investing in or trading crypto assets comes with a risk of financial loss.



