
 Dacity Coin
 Pearl
Pearl Bitcoin
 Sui
Sui Quantus
 Injective
 Zcash
Zcash
- The OCDO stock price is currently trading at 729.4 GBX.
- The company chart is reflecting bullish sentiment in the price right now.
The Ocado (LSE: OCDO) company was founded on April 2000 by Jonathan Faiman, Jason Gissing, and Timothy Steiner. The company engages in the operation of online grocery supermarkets.
Ocado (OCDO) Stock: Financial Analysis
The Ocado company has shown stable growth in the revenue report over the last three years from 2020 to 2023 with an overall growth of 0.07%.
The OCDO company estimates to have a 2.77 Billion growth in the 2023 revenue report. Over the last three years, the company closed just below the estimated revenue value. It demonstrates the company has the capacity to meet the expected revenue growth in 2023.
Ocado (OCDO) Stock: Technical Analysis
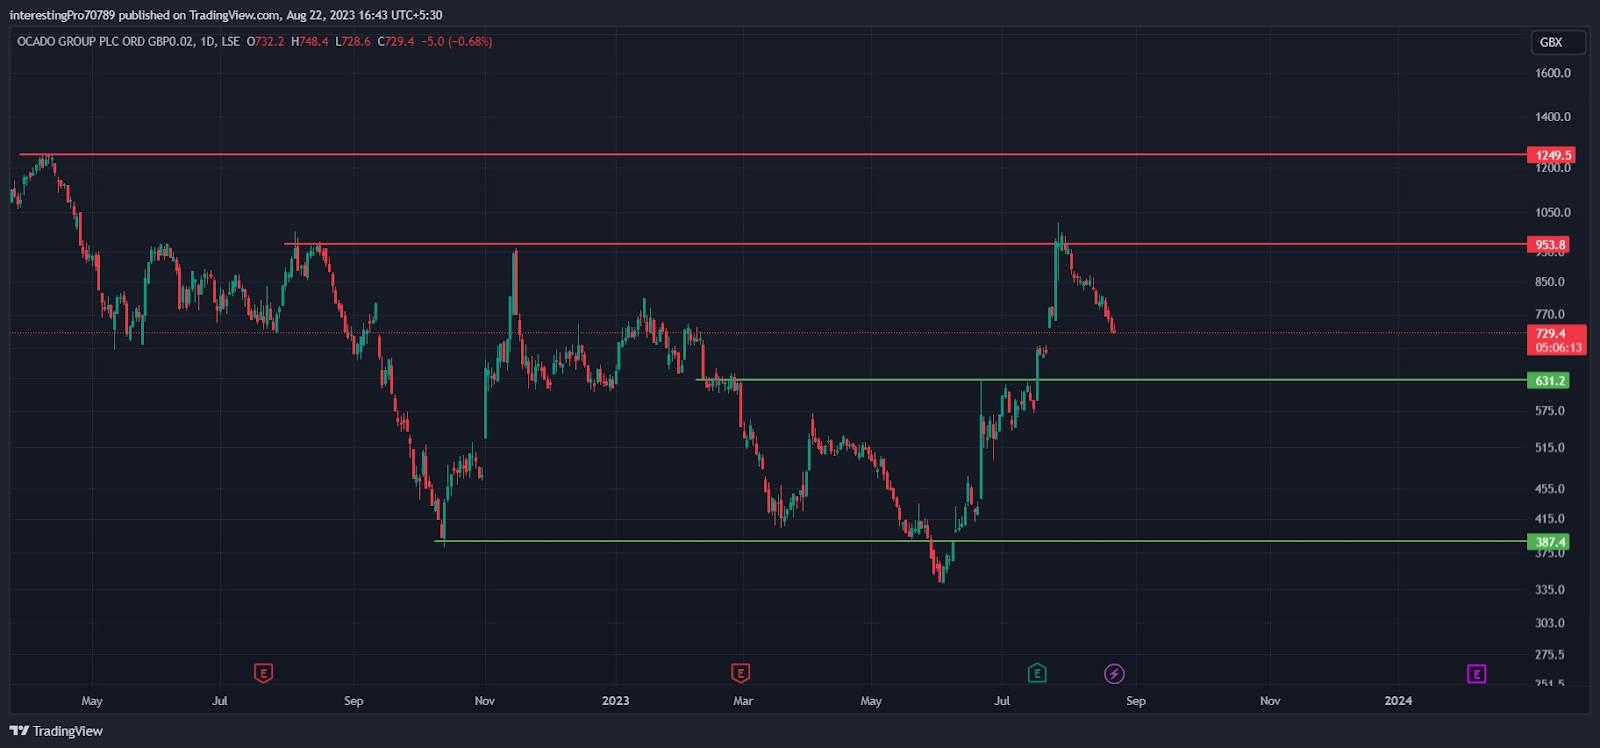
The Ocado stock price is trading in the consolidation range for the last 52 weeks.
The price of Ocado stock faced rejection from the 953.8 GBX in August 2022 and it started falling. After the fall of almost 6% the price formed support from 387.4 GBX and commenced a bullish rally. The price did a V shape recovery and covered the fall in just 22 trading days.
In October 2022, the price again faced rejection from the 953.8 GBX resistance. It was in a consolidation phase for 60 trading days.
In February 2023, the OCDO price gave the breakdown of that consolidation zone. The price was again falling to 387.4 GBX support.
In May 2023 also the price tried to give the breakdown of the 387.4 GBX support. It didn’t succeed and the breakdown was turned into a fakeout. After that price again commenced a bullish rally with a gap-up scenario till 953.4 GBX resistance.
The Ocado price recently faced rejection from the 953.4 GBX resistance and is now filling the gap. As long the price sustains over the 631.2 GBX, the bullish sentiment will be there. The price has to give the breakout of 953.8 GBX resistance to continue its bullish rally. Otherwise, the price can be seen in the consolidation phase between these two levels.
If the price breaks 631.2 GBX, it may fall back to the 387.4 GBX support.
Technical Indicators’ Prediction About the Current Trend
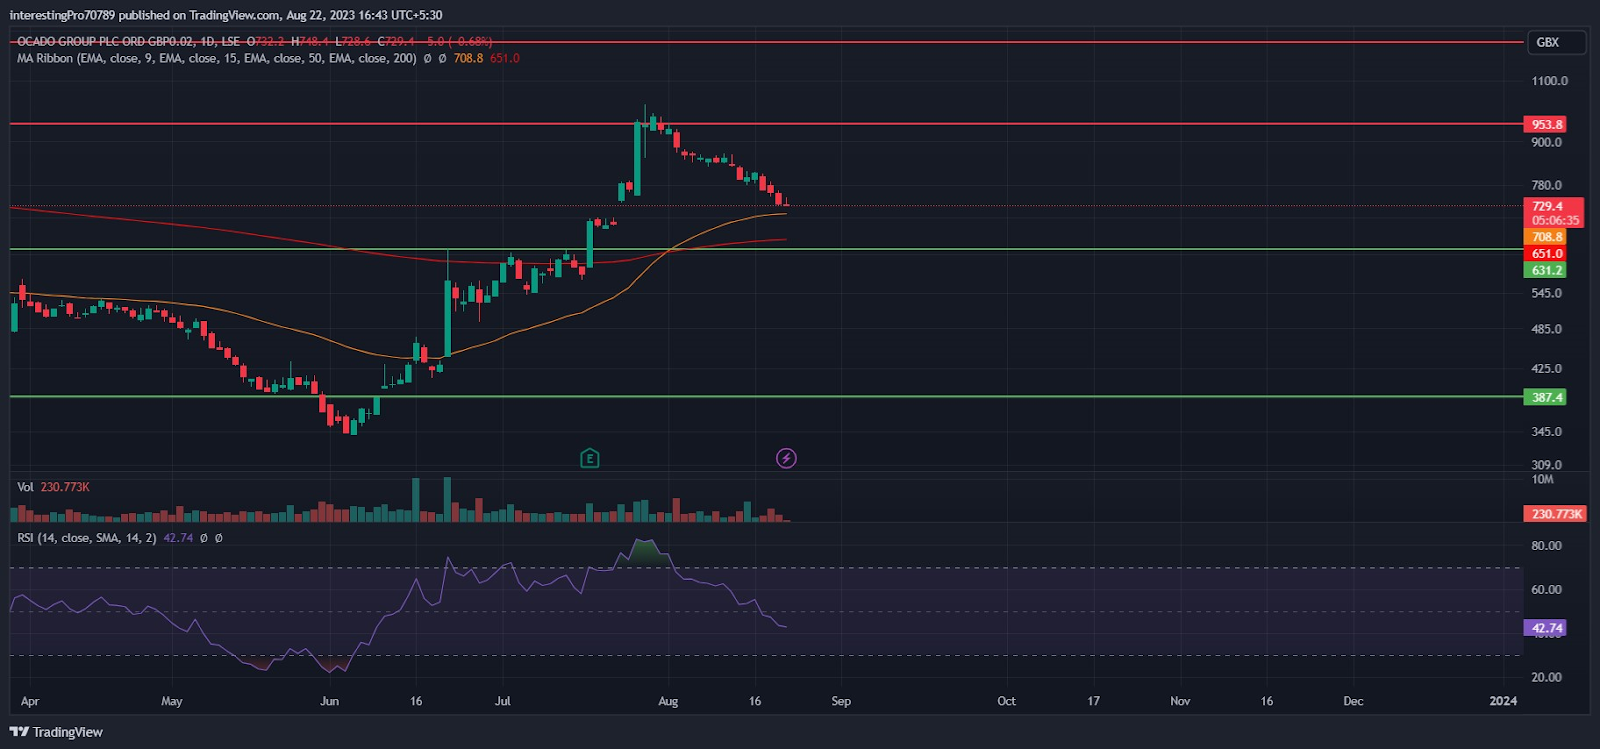
The 50 EMA (yellow line) is at 708.8 GBX and the 200 EMA (red line) is at 651 GBX. Currently, the Ocado stock price is trading above both the EMA’s. There is a crossover of the EMA where the 50 EMA intersects the 200 EMA from downside to upside. This indicates the bullish sentiment in the price.
The relative strength index (RSI) line is at 42.74. The RSI indicates the price is in a neutral state taking pressure from both buyers and sellers.
Conclusion
The overall chart of Ocado is bullish. As long as the price sustains above 631.2 GBX support, it can be seen in bullish sentiment. But to continue its bullish trend the price must give the breakout of 953.8 GBX resistance. If the price breaks below 631.2 BGX support, it can fall to 387.4 GBX support.
Technical levels
Resistance levels: 953.8 GBX and 1249.5 GBX.
Support levels: 631.2 GBX and 387.4 GBX.
Disclaimer
The views and opinions stated by the author, or any people named in this article, are for informational purposes only. They do not establish financial, investment, or other advice. Investing in or trading crypto assets comes with a risk of financial loss.




