
 Dacity Coin
 Injective
 Starknet
 NEAR Protocol
 Pearl
Pearl Quantus
 Pump.fun
- The ONT stock price is trading at 236 GBX.
- The company stock price is forming an ascending triangle pattern.
Oxford’s Nanopore Technologies Plc (LSE: ONT) was founded in 2005 by Gordon Sanghera, Spike Willcocks, and John Hagan Pryce Bayley. The company creates a proprietary technology platform for single-molecule electrical analysis. The firm also creates instruments like GridIONTM and MinIONTM. Those instruments are adaptable for the analysis of DNA, RNA, proteins, small molecules, and other types of molecules.
Oxford Nanopore Technologies Plc (ONT) Stock: Financial Analysis
Oxford’s Nanopore Technologies Plc has performed well in the last two years. Its revenue report shows an overall growth of 0.48%.
The ONT company’s estimated revenue value in 2023 is expected to be 177.91 Million GBP. It is less than the previous year. The company has also achieved its estimated revenue value over the last two years. The firm does have the potential to attain its estimated revenue in 2023.
Oxford Nanopore Technologies Plc (ONT) Stock: Technical Analysis
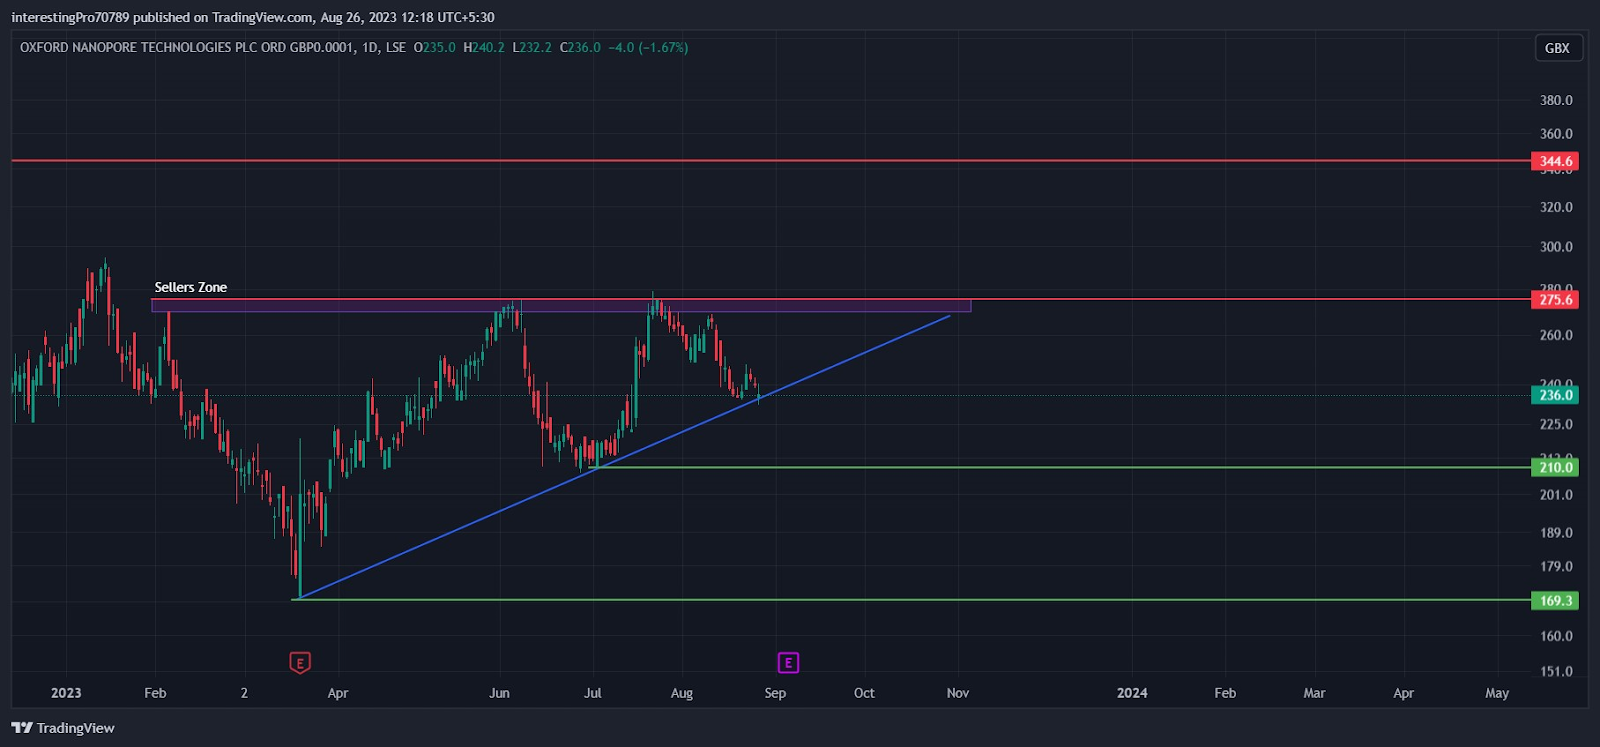
In February 2023, the ONT stock price faced rejection from the 275 GBX. The price then fell continuously. After falling for 3 months straight, buyers pushed the price in the upward direction and formed a strong bullish candle at 169.3 GBx. The price commenced a bullish rally by recovering the fall.
The price was again seen at 257 GBX after commencing a bullish rally. It also tried to give the breakout. However, it got rejected from there and started falling. After that fall the price took support from the trendline which was coming from below.
The price again showed a bullish momentum after taking support from the trendline. It was trading below the 257 GBX level and the buyers were trying to give the breakout of that level. The price got a rejection from the 257 GBX resistance and fell again.
Currently, the price is taking support from the trendline and is forming an Ascending triangle pattern. That’s a bullish pattern. So, now the gap left inside the ascending is much less. The price can form a strong bullish candle at the trendline and rally to give the breakout of the 257 GBX resistance. It may get to its next resistance at 344.6 GBX.
If the price breaks below the trendline, it may fall to 210 GBX support. Suppose the price breaks below the 210 GBX support, the next support is at 169.3 GBX.
Technical Indicators’ Prediction About the Current Trend
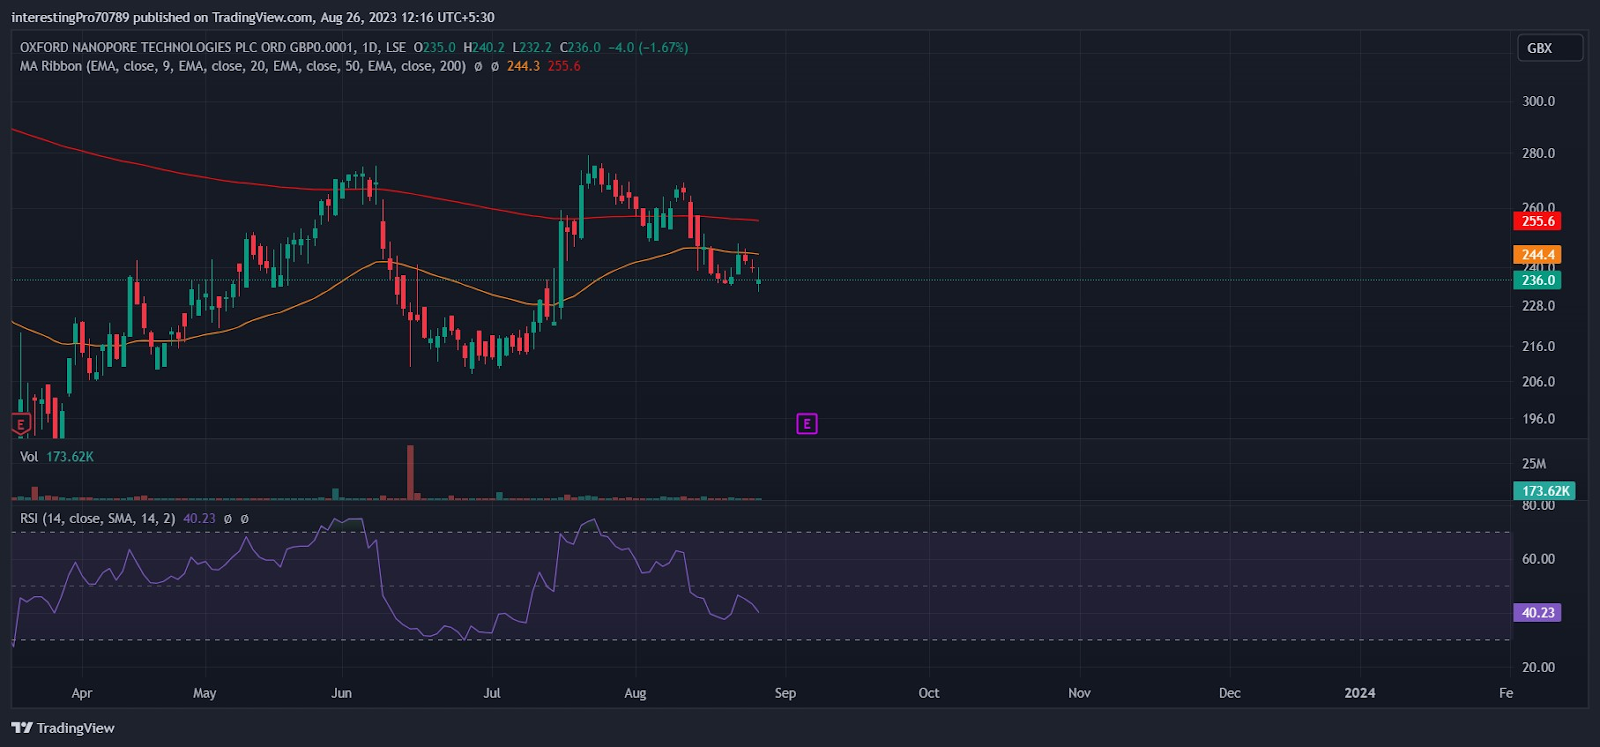
The 50-EMA (yellow line) is at 244.4 GBX and the 200-EMA (red line) is at 255.6 GBX. The ONT stock price is trading below the 50 and 200 EMA but the EMA line is completely sideways. It indicates that the price is in bearish sentiment. There is also some influence of buyers and it is preventing the price from giving a one-directional move.
The relative strength index is at 40.23. The RSI is in neutral territory indicating the price of ONT stock is taking pressure from buyers as well as sellers.
Conclusion
The overall chart of the ONT stock is bullish. The buyers are showing their dominance with the continuous uptrend in the price. The ONT stock is also forming an Ascending triangle pattern, which is a bullish pattern. The breakout of the 257 GBX resistance will give bullish momentum to the price.
Suppose the price breaks below the trendline, the sellers may dominate the price.
Technical levels
Resistance levels: 257 GBX and 344.6 GBX.
Support levels: 210 GBX and 169.3 GBX.
Disclaimer
The views and opinions stated by the author, or any people named in this article, are for informational purposes only. They do not establish financial, investment, or other advice. Investing in or trading crypto assets comes with a risk of financial loss.




