
 Dacity Coin
 Injective
 Starknet
 NEAR Protocol
 Pearl
Pearl Quantus
 Pump.fun
- Renishaw share price has been consolidating in a range of 3300 and 4300 GBX.
- The RSW stock price declined slightly by over 5% in a year.
- Rating firm Jefferies cut down the target price of RSW stock from 3270 GBX to 3070 GBX.
The current market price of the Renishaw is 3450 GBX.
The Renishaw stock price has shown a smart reversal from the lower level. The stock price jumped 3.79% in the last trading session with a rise of 126 GBX. After a huge gap-up opening, the share has seen a decline towards the previous day’s low level. As the day progressed, the stock witnessed a smart recovery and closed the day with a good rise.
The Renishaw share price formed a bullish pin bar candlestick on the daily chart. It is a well-known bullish reversal pattern that can possibly reverse the trend. This candlestick has formed at the support level. The stock has been consolidating in a tight range of 3300 GBX and 4300 GBX for more than a year.
Rating Firm Jefferies has cut down on the target price for the stock. The target price has been revised from 3270 GBX to 3070 GBX. It can be one of the major reasons for the current consolidation of the stock. The stock price declined by over 2% in a week, 1% in a month, and 5% in a year.
The Chart is Looking Flat, Will the Price Escape This Trap?
RSW stock price has recently broken the rising trendline support which is a major bearish signal as of now. The stock price is sustaining below this trendline and is currently trading at the support level. This is a very crucial support for the price as the stock has been holding this level for more than a year. The stock has been declining from the 6500 GBX level due to poor revenue and profit growth.
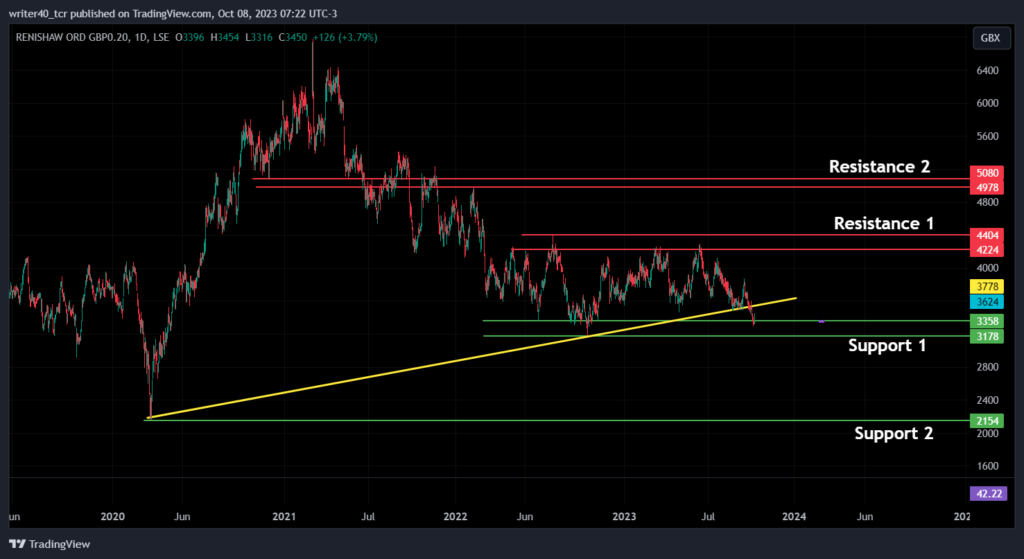
RSW stock price can face a rejection from the trendline marked as yellow on the chart. If we consider the other resistance levels, then they are present at 4224 – 4400 GBX and 4978 -5080 GBX levels. The support levels for the stock are present at 3358 – 3178 GBX and 2154 GBX.
Glimpse at the Technical Indicators
Bollinger Bands
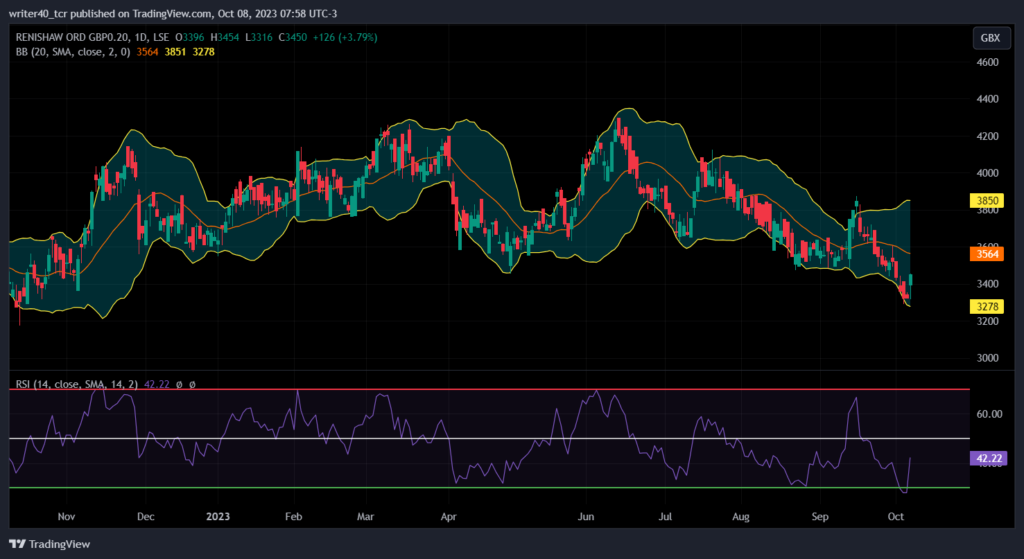
RSW stock price has shown an amazing jump from the lower band level. The bands of the indicators i.e. upper band and lower band are present at 3850 GBX and 3278 GBX respectively. The median level of the indicator is present at 3564 GBX level which can act as a resistance for the stock.
Relative Strength Index
The relative strength index is placed at 42.2 level and the slope of the RSI is upward. It indicates that the bulls are gaining momentum over the price. Before yesterday’s move, the stock price was in an oversold trajectory. This helped the stock to show some aggressive upside.
Conclusion
The RSW stock price has shown a breakdown from the trendline, which is a negative sign for the share. If the price breaks the lower level of 3178 GBX, then the stock price can move towards 2154 GBX. if the price shows a reversal, then it can face rejection from the level of 4224 GBX.
Technical Level
- Resistance Levels: 4224 GBX and 4978 GBX
- Support Levels: 3178 GBX and 2154 GBX
Disclaimer
The views and opinions stated by the author, or any people named in this article, are for informational purposes only. They do not establish financial, investment, or other advice. Investing in or trading crypto assets comes with a risk of financial loss.




