
 NEAR Protocol
 Pyth Network
 Uniswap
 Pearl
Pearl Quantus
 Aerodrome Finance
 Starknet
- The price of EOS is presently giving a sideways movement.
- It is currently trading at $0.565 with an intraday repulse of 1.9%.
- The token is down by 97.53% from its all-time high.
The EOS token has been in a bearish downtrend after making its yearly high of $1.34 in the first week of March. After marking the yearly high, the price almost declined by 75%. Currently, the price is trading in a sideways movement.
EOS has marked its all-time high on 29th April 2018 when it was priced at $22.89.
The trading volume of the token dropped by 52% in the last 24 hours.
The present market capitalization of the token is $624.09 Million. The total supply of the token is circulating in the market. The 24-hour trading volume of the token is $39.19 Million.
EOS Token Sentiment Analysis
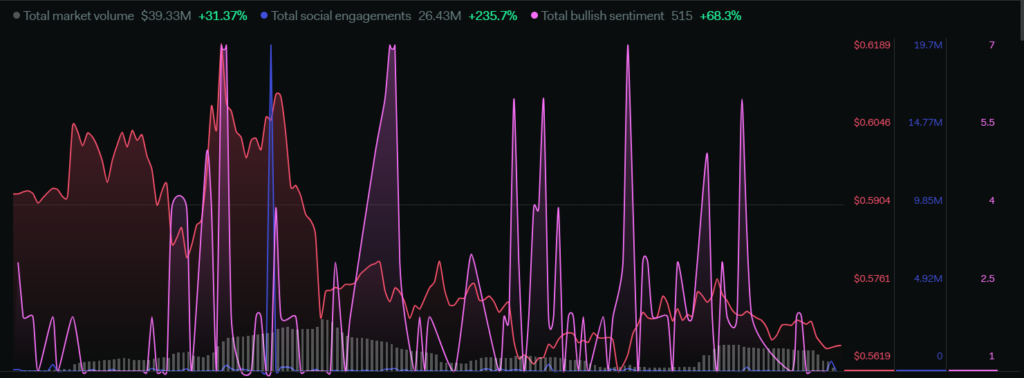
The total market volume of the token increased by 31.37%. Social engagements have seen a rise of 235.7% and the total bullish sentiments have surged by 68.3% in the last week.
The overall sentiments suggest a bullish movement in price in the upcoming days. As the social community is on the active side, the volume increased by 31.37% in a week.
The daily volume of the token is falling which is bearish for the price in the daily timeframe.
Technical Analysis For EOS in Daily-1D Timeframe
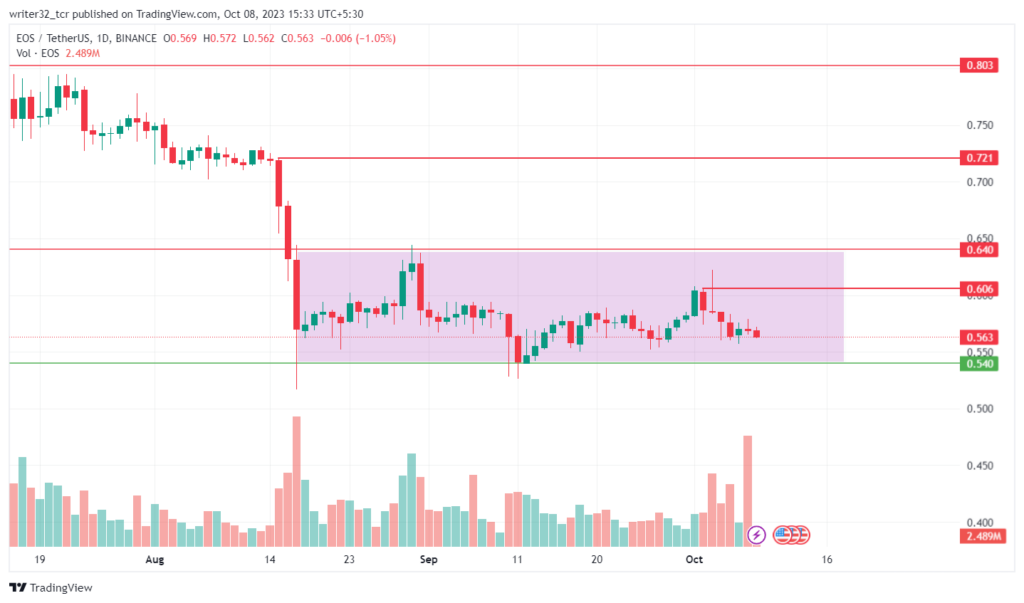
The price of the EOS token was under a bearish trend till $0.540. From there, the price took support and started to move in a sideways movement. The price is giving movements between $0.540 to $0.640.
Currently, the price was rejected from the $0.60 resistance level and came down. The price is likely to take support from the $0.540 level again.
The price needs a major move above the resistance of $0.60 and $0.64 so that the price can break the sideways movement and reach $0.72. For this movement, the volume has to surge in the daily timeframe. The bullish investors have to keep their dominance while the price will move upward.
Contrastingly, if the price breaks the sideways movement and goes below the support level of $0.540, then the price can continue its bearish movement and fall further.
Indicators On the EOS Price Trend
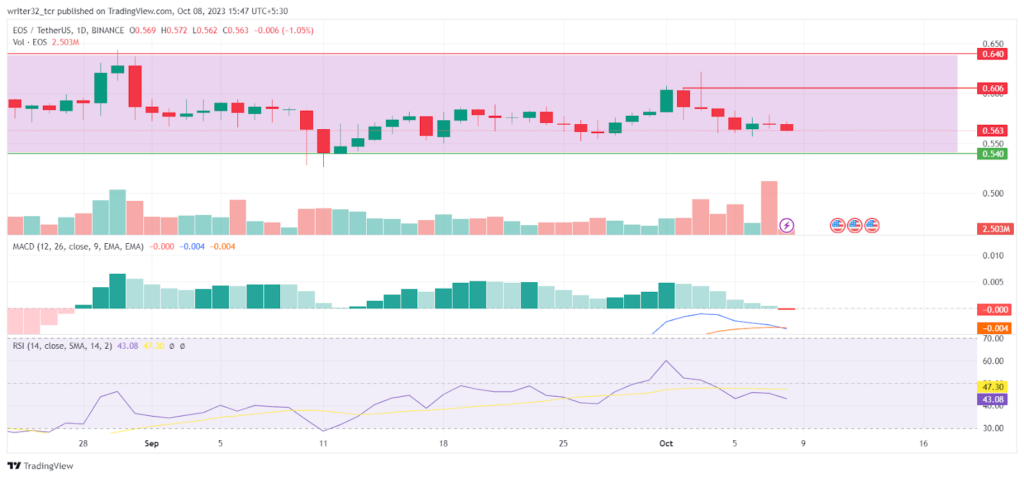
Relative Strength Index (RSI)
The RSI line is presently moving at 47.30 points and the SMA 14 is moving at 47.30 points. RSI is below the neutral level of 50. RSI is indicating a bearish move as it is moving below the SMA 14. When the RSI enters the oversold region, the entries can be made for an upward move.
Moving Average Convergence/Divergence (MACD)
The fast blue line moving average is above the red slow line moving average. The histogram shows low volume and continuous falls. This is an indication of a bearish move in the price. The volume needs to rise for any bullish move in the future.
Conclusion
The current analysis of the EOS token suggests that the price can be bearish as the volume decreases in the daily timeframe. The price can go down till the $0.540 support and start moving upward. Moreover, if the price smashed the resistance levels of $0.60 and $0.64, then the price could strike to the level of $0.72.
Technical Levels
- Support Level: $0.540
- Resistance Level: $0.60, $0.64, $0.72 and $0.80
Disclaimer:
The views and opinions stated by the author, or any people named in this article, are for informational purposes only and do not establish financial, investment, or other advice. Investing in or trading crypto assets comes with a risk of financial loss.




