
 Dacity Coin
 Pearl
Pearl Bitcoin
 Sui
Sui Quantus
 Injective
 Zcash
Zcash
- Future Metals started the drill program at the Phantom Project.
- FME stock has been in a downtrend throughout the year.
- FME stock closed at £2.10 with a gain of 10.53% in the past intraday session.
Future Metals (FME) stock closed at £2.10 while witnessing a surge of 10.53% in pre-market trading. The current surge shows a sign of reversal. The current price action is challenging the 20-day exponential moving average (EMA), and if the next candle closes above the high of the current candle, it could signal potential strength in the short term. This could lead to a retest of the short-term EMAs.
FME stock price has been experiencing a downtrend since the start of 2023. The price slid from the high of £6.40 towards the present low of £1.69, forming a pattern of higher highs and lows. However, the chart displays a double-top pattern, indicating a high possibility of bearish reversal.
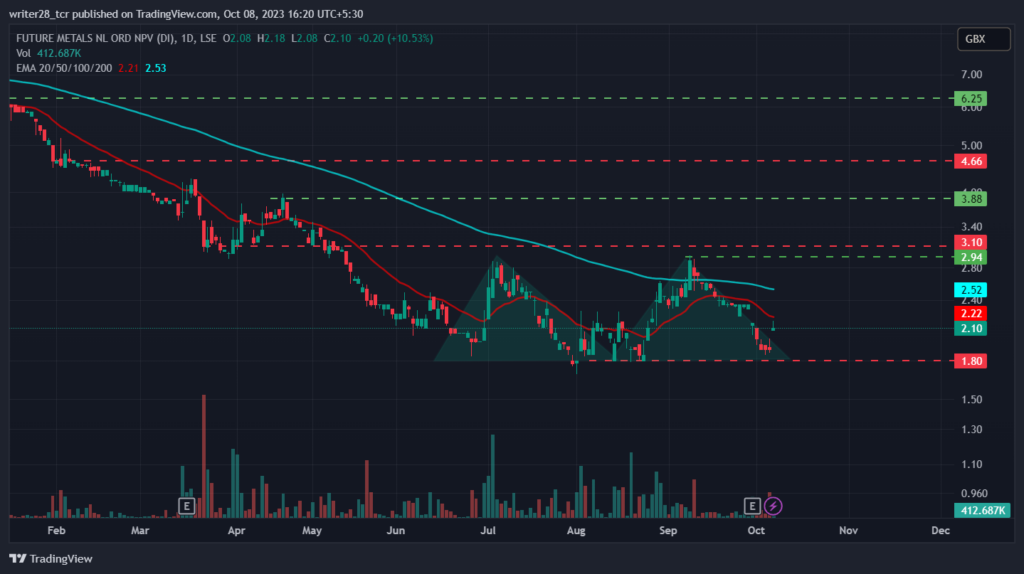
The FME stock price has declined by 13.76% over the past month, emphasizing sellers’ interest during this period. Thus, the price action also points to bearish momentum and indicates the possibility of a further sell-off. If Future Metals attracts more bears, the price might melt and retest the £1.69 annual low.
The year-to-date and the three-month returns show negative results of -64.41% and -16.83%, respectively. Furthermore, the market capitalization is £8.199 Million with an average volume of 646.88K shares.
Future Metals Started the Drill Program At Phantom Project
Future Metals began its drill program at the Phantom North Project in Western Australia. The program tested the BC1 and rock chip sampling, which discovered anomalous nickel sulfide mineralization in the area. The Western Australian government provided funding support of AU$147,000 to the Phantom project under the exploration incentive scheme.
Will FME Stock Retest the 20-day EMA?
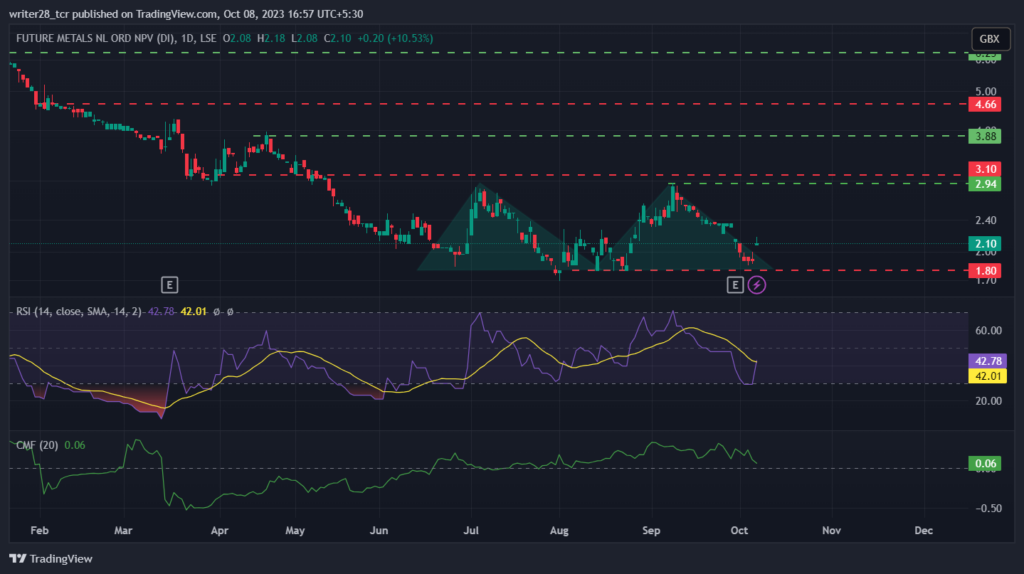
The FME stock price is currently hovering below the significant moving average and showcases a downtrend trendline. Moreover, the price is facing bearish dominance and hinting at a further sell-off. However, the price is currently challenging the 20-day EMA.
The relative strength index (RSI) has recently bounced back from the oversold zone at 42.78. This indicates the price’s slight weakness and suggests a possible reversal.
The CMF has been hovering above the 0.00 mark since August 4, 2023. This denotes that the price witnessed a bullish sentiment after a prolonged downtrend. However, the CMF is currently at 0.06, suggesting a slight strength during the intraday session.
Conclusion
The market structure and price action of Future Metals (FME) stock reveal the dominance of bears. However, the current price surge of 10.53% in the past intraday session signals that a relief rally is possible.The technical parameters are currently indicating a potential for further selling pressure in the market. To confirm this bearish sentiment, investors should keep an eye out for a bearish candlestick pattern that suggests a strong sell-off is imminent.
Technical Levels
Major resistance: £6.40 and £4.28
Major support: £1.69 and £1.84
Disclaimer
The views and opinions stated by the author, or any people named in this article, are for informational purposes only. They do not establish financial, investment, or other advice. Investing in or trading crypto assets comes with a risk of financial loss.




