
 Bitcoin
 Pearl
Pearl Starknet
 Zerebro
 NEAR Protocol
 Solana
 Quantus
- The YFI has lost its value by more than 45% in the last 11 trading days.
- Yearn Finance has witnessed a huge surge in its trading volume.
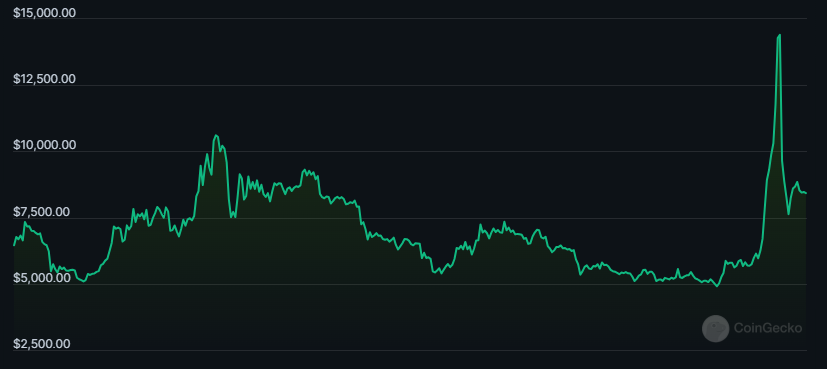
Yearn.finance (YFI) is a decentralized finance (DeFi) protocol that simplifies and optimizes yield farming. Andre Cronje created this platform in 2020. It automatically finds and invests in the best-yielding opportunities in DeFi, such as lending, liquidity provision, and AMM pools. YFI token holders can also govern the protocol.
As per Coingecko, the current market cap rank of the Yearn Finance is 159th, resulting in a market cap of $280.076M. The market cap dominance of the YFI coin is 0.019% and its volume/market cap ratio is 0.2072.
The trading volume of the YFI crypto has declined by 32.06% in the last 24 hours to $63.857M. It results in a volume ranking of #87 as per Coinmarketcap. The current volume/market cap ratio of the crypto is 23.38%. The resulting circulating supply of the crypto is 33.2K YFI.
The fully diluted market cap of the Yearn Finance is $308.046M. The total supply for the YFI crypto is 36.6K YFI. Its all-time high price reported is $90,786.89 and the crypto has declined by 90.70% since then.
YFI Derivatives Analysis
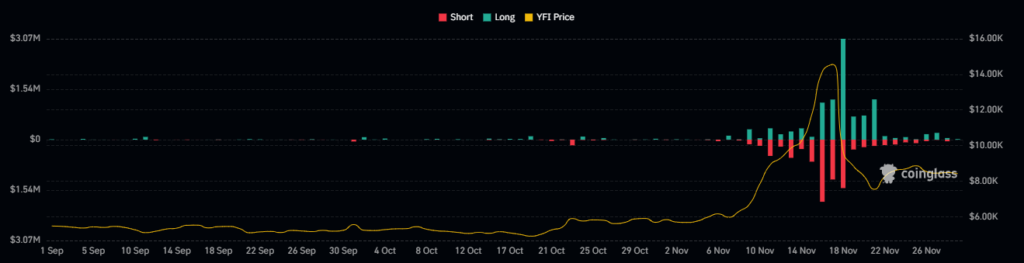
The derivatives volume for the YFI crypto has declined by 20.31% in the last 24 hours resulting in a decline of 3.92% in the open interest. The short liquidation of the crypto is higher as compared to the long liquidation. Despite that, the YFI token has witnessed a huge long liquidation in the last few days. It shows that the sellers are ruling over the price.
TVL vs Volume of YFI Crypto
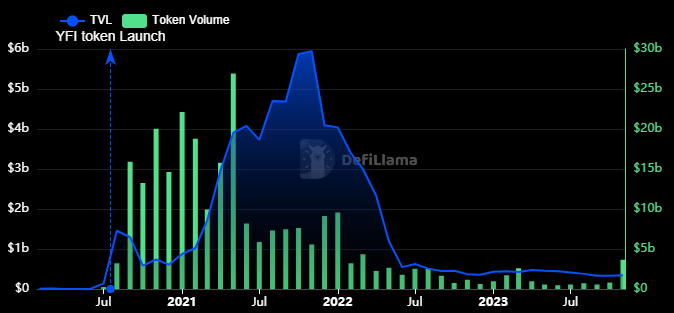
The volume and the TVL of the YFI crypto have subsequently declined with time. The following factors were at the peak at the time of the launch of the crypto. It means the interest and activity of the community have declined for the Yearn Finance with time.
YFI Crypto Technical Analysis
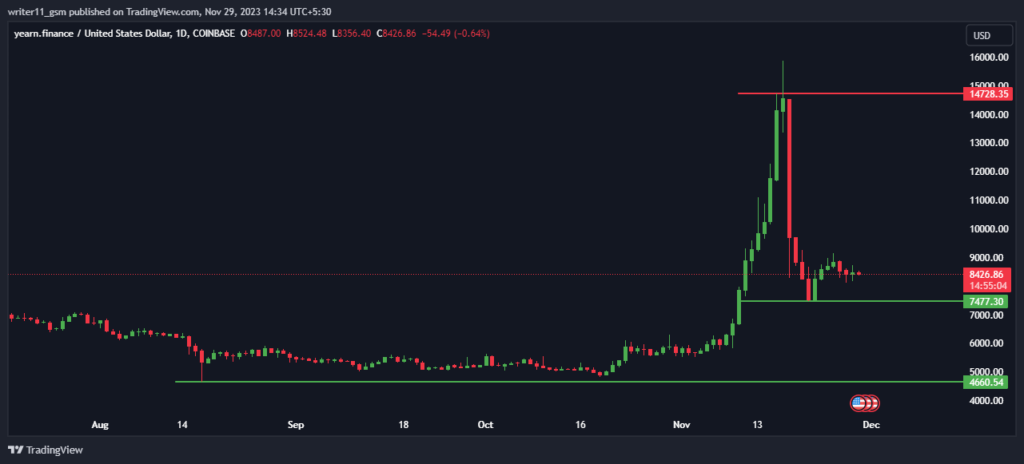
After witnessing very good gains from the lower levels the YFI crypto price lost its value by more than 45% in just a few days. This huge decline in the price is a sign of a shift of market sentiment to bearish.
YFI/USD Live Chart by TradingView
However, the YFI crypto price is trading above the 50-day and the 200-day EMAs following the Golden Cross, the price is extremely negative. In the upcoming days if the crypto price breaks below the crucial following EMAs, it might result in a strong downtrend.
The RSI on the daily chart of YFI trading above the overbought zones has also suddenly declined below the 50 level. This behavior of the indicators indicates that the price has faced a sudden decline.
Conclusion
The YFI crypto is bearish as it has lost more than 45% of its value in a few days. The market cap, volume, TVL, and derivatives volume have all declined. The price has broken below the overbought zones and the 50 level on the RSI. This coin’s price price may enter a strong downtrend soon and lead to further lower levels.
Technical Levels
- Support levels– $4830.00 and $7550.00
- Resistance levels– $11190.00 and $14571
Disclaimer
The views and opinions stated by the author or any other person named in this article, are for informational purposes only and do not constitute financial, investment, or other advice. Investing in or trading crypto or stocks comes with a risk of financial loss.




