
 astronaut
 Pearl
Pearl Zylo Ecosystem
 Bitcoin
 Bitway
 NEAR Protocol
 Zcash
Zcash
- The market cap of the XDC Network has consistently increased for the last 24 hours.
- XDC Network is an EVM-compatible, layer 1 blockchain.
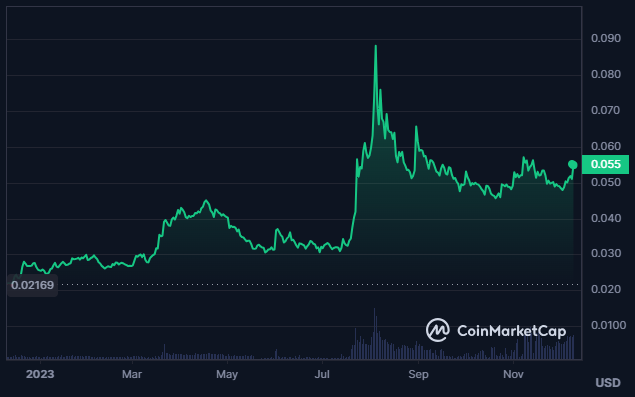
XinFin Network (XDC) is a hybrid blockchain for trade and finance. It uses the XDC protocol, which is fast, secure, and scalable. XDC is the native token that powers the network and its DApps. XinFin aims to bridge the infrastructure funding gap with blockchain technology.
The XDC crypto is trading with a circulating supply of 13.882 Billion XDC. This results in a fully diluted market cap of $2.069 Billion for the crypto. The current market cap dominance of the crypto is 0.043%.
The current market cap rank of XDC crypto, as per Coingecko, is 82nd and the volume/market cap ratio of the crypto is 0.0282. Moreover, XDC hit an all-time high price of $0.192854 on August 21, 2021.
The market cap of XDC has increased by 6.5% in the last 24 hours and the trading volume has advanced by 10.7%. Additionally, the circulating supply of XDC is 13.882 Billion XDC. This further results in a fully diluted market cap of $2.063 Billion.
What Does Blockchain Data Say About XDC Network Crypto?
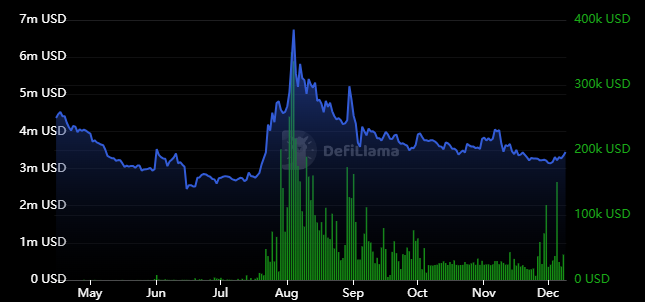
Compared to August 2023, the TVL of the crypto has declined along with a decline in trading volume. The current reported TVL of the crypto is $3.44 Million and the traded volume fis $38.95K.
What Do Technical Charts of XDC Network Crypto Show?
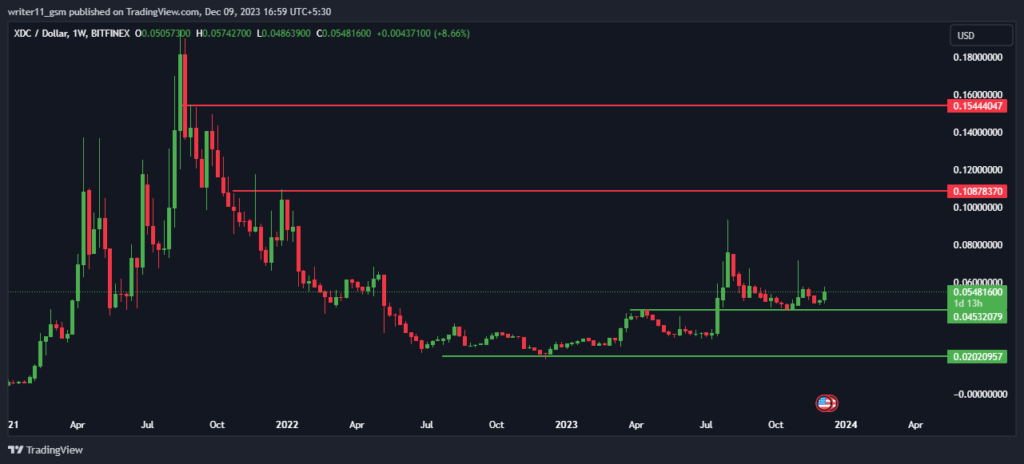
The XDC crypto has broken above the crucial resistance level of $0.0547 and the price is sustaining above the same. It is forming bullish candlesticks on the chart, indicating an uptrend.
XDC/USD Chart by TradingView
The most crucial EMAs such as the 20,50 and 200-day EMAs are indicating uncertainty as they overlap with each other. Despite this, the pierce has broken above these EMAs.
The RSI for the XDC crypto is situated above the 50-level, indicating bullish momentum. It has risen above the 14-day SMA line. This shows the buyers’ presence in the crypto market and their dominance.
Conclusion
XDC Network is a hybrid blockchain platform for trade and finance. It has a high market cap, a low volume/market cap ratio, and a high open interest. The price has risen by over 150% in the last year and the RSI is positive. Therefore, the price of the crypto might continue to rise to higher levels.
Technical Levels
- Support levels- $0.020 and $0.050
- Resistance levels- $0.1080 and $0.1540
Disclaimer
The views and opinions stated by the author or any other person named in this article, are for informational purposes only and do not constitute financial, investment, or other advice. Investing in or trading crypto or stocks comes with a risk of financial loss.




