
 Zerebro
 Bitcoin
 Aerodrome Finance
 ZKsync
 Pearl
Pearl Pudgy Penguins
 Bitway
- In the last two months, LOOM Crypto has lost its value by more than 70%.
- The trading volume of the LOOM network is also declining.
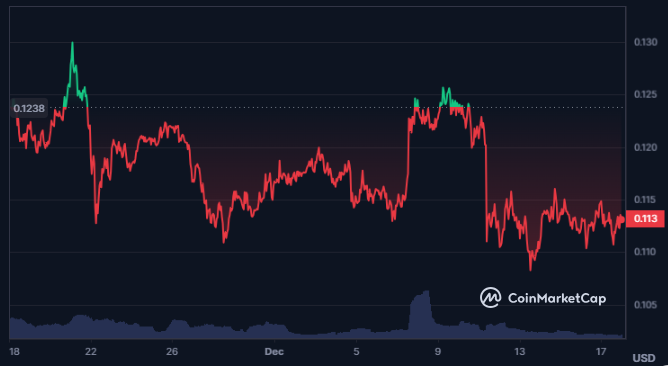
Loom Network is a platform for scalable and interoperable dApps, especially games and NFTs. It was founded by Duffy, Campbell, and Zhang in 2017. The LOOM token is used for fees, features, incentives, rewards, and governance.
With a huge decline in the trading price, the volume of the LOOM crypto has also declined by 19.38% in the last 24 hours. Moreover, the traded volume for the crypto in the last 24 hours is $9.858M.
The market cap of the Loom Network has also declined by 1.73 in the last 24 hours, resulting in $137.359M. The current market cap ranking of crypto as per CoinMarketCap is #280 and the volume ranking is #298.
The market cap dominance of the crypto has declined to 0.008%. It results in a volume/market cap ratio of 0.0457.
LOOM Network Token Overview
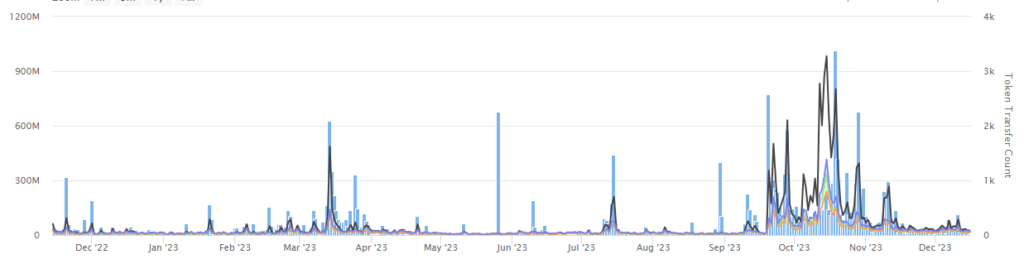
The crypto has a max total supply of 1.3B LOOM and 7.6K holders of the token. The fully diluted market cap of the crypto is $147.192M and the circulating supply market cap of the crypto is $138.137M.
LOOM Crypto Technical Analysis
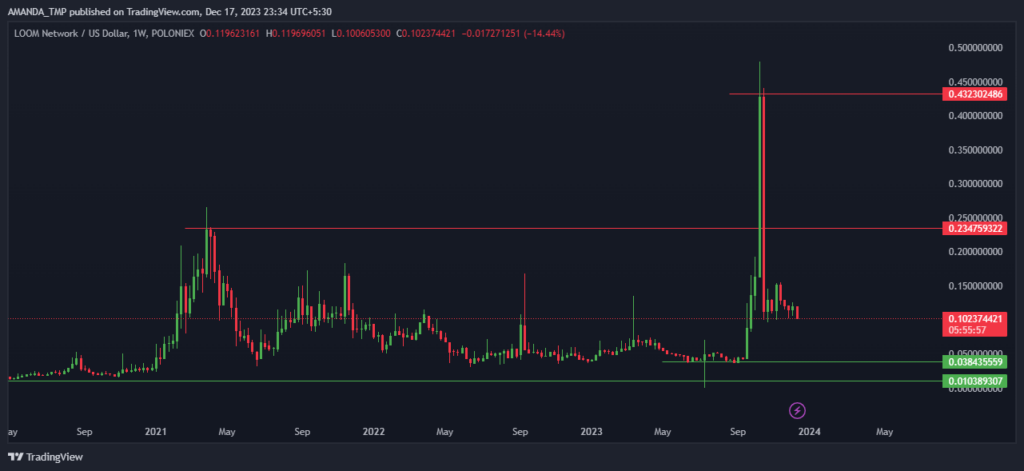
Looking at the charts it can be clearly seen that the LOOM crypto price gave a huge spike of 1100% from the swing lows and lost its value by more than 70% from the top. This behavior of the crypto price shows the intensity of the hoax created by the price.
LOOM/USD Chart by TradingView
The LOOM Network crypto price is following declining momentum on the charts by forming bearish candlestick patterns.
The EMAs such as the 50-day and the 200-day EMA are trading in a golden cross on the charts. Despite this the price of the crypto is currently trading between the EMAs and the price might continue to decline to further lower levels.
The RSI on the other hand has declined below the 50-level with the 14-day SMA, which indicates weakness in the trading price momentum.
Conclusion
The LOOM Crypto has experienced a drastic 70% decline in the last two months, coupled with a 19.38% drop in trading volume. Technical analysis reveals bearish trends, with EMAs forming a golden cross and RSI indicating weakening momentum. The intense price volatility suggests a potential downturn soon.
Technical Levels
- Support levels- $0.01038 and $0.0972
- Resistance levels- $0.2347 and $0.4323
Disclaimer
The views and opinions stated by the author or any other person named in this article, are for informational purposes only and do not constitute financial, investment, or other advice. Investing in or trading crypto or stocks comes with a risk of financial loss.




