
 Zylo Ecosystem
 Walrus
 Pudgy Penguins
 Pearl
Pearl Bitcoin
 Aerodrome Finance
 Quantus
- The open interest of the SEI crypto has declined in the last 24 hours.
- The max supply of the SEI crypto is not defined, as per CoinMarketCap.
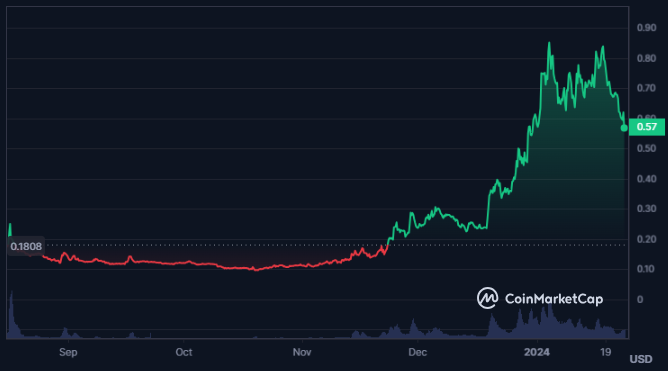
Sei is a fast and secure Layer 1 blockchain for Web3 applications, especially digital exchanges. It uses a novel consensus mechanism and offers various features. SEI is its native token that has multiple roles and benefits. Sei was created by Jeffrey Feng and Jayendra Jog, along with a skilled team.
The SEI crypto has a circulating supply of 2.425 Billion SEI and the total supply of the crypto is 10.0 Billion SEI while the trading volume of the crypto has increased by 35.8% in the last 24 hours.
The fully diluted market cap of the SEI crypto is $5.657 Billion and the volume/market cap ratio is 27.52%. Additionally, the market cap has declined by 6.5% in the last 24 hours, resulting in a value of $1.369 Billion.
SEI Crypto Derivatives Analysis
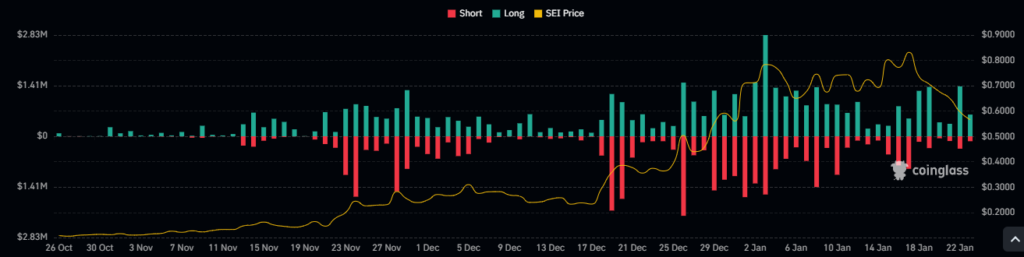
The derivatives trading volume of the SEI crypto has increased by 60.2% in the last 24 hours, resulting in a value of $772.19 Million. Additionally, the open interest has declined by 12.07% and there is a long/short ratio of 0.9581.
Furthermore, the reported long liquidation for the crypto is higher when compared to the short liquidation of $353.11K. This shows that the sellers have been ruling over the price in the last 24 hours.
SEI Crypto Technical Analysis
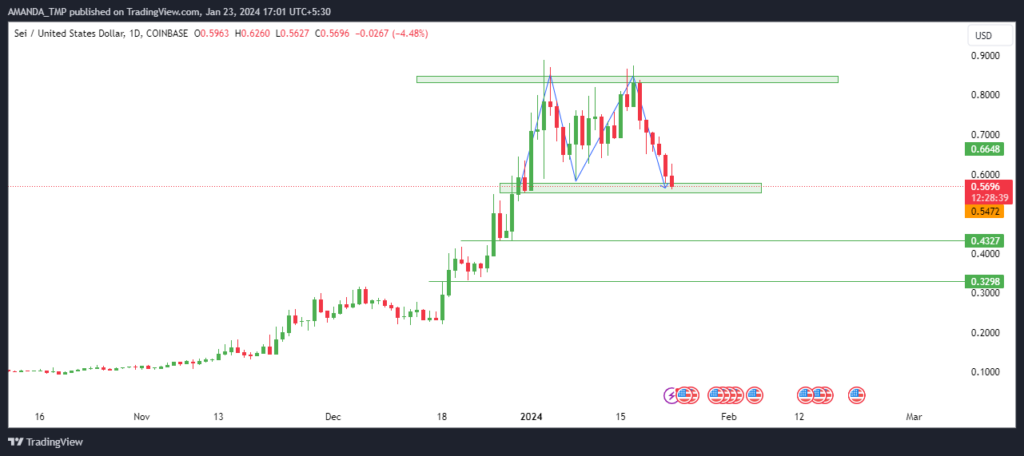
The SEI crypto price has formed a double-top pattern on the daily chart and the price is consistently declining to lower levels. Additionally, the price of the crypto is taking support at the most crucial support but the intensity of the bearish candle shows the possibility of a breakdown in the price.
SEI/USD Chart by TradingView
The trading price of the SEI crypto has declined below the 20-day EMA and is leading towards the 50-day EMA. If the price of the crypto breaks below the 50-day EMA, we might see a further decline.
The MACD and the signal lines are forming a bearish cross and the MACD is forming a consistent bearish histogram on the chart, indicating a downtrend.
The RSI is also declining from the overbought zones and is leading toward new lows declining below the 14-day SMA. This behavior of the indicator shows bearishness on the chart.
Summary
The SEI crypto price is facing a strong downtrend and has formed a double-top pattern. The indicators are also showing weakness and the volume/market cap ratio is high. The price of SEI may continue to fall unless it breaks above the resistance level.
Disclaimer
The views and opinions stated by the author or any other person named in this article, are for informational purposes only and do not constitute financial, investment, or other advice. Investing in or trading crypto or stocks comes with a risk of financial loss.




