
 Zerebro
 Bitcoin
 Quantus
 Pearl
Pearl Starknet
 ZKsync
 NEAR Protocol
- The Ronin crypto price has risen by 57% this month.
- A bullish crossover between the RSI and RSI-based moving averages has been generated.
According to the technical chart, the Ronin crypto price has been in a bullish trend and has risen by 57% in March. In mid-March, the bullish trend of Ronin (RON) price was disturbed near $4.50 and declined by 30% in a week. Currently, the buyers have lifted the price to the last swing high.
Ronin’s crypto price is trading at $4.26 with an intraday gain of 2.01%. The market capitalization is $1.31 billion, and the 24-hour trading volume is $61.48 million. The circulating supply is 305,183,150 RON, and the total supply is 1,000,000,000 RON. The fully diluted market cap is $4.30 billion.
Current Price – $4.26 Price Prediction – $3.81 (-10.81%)
Market cap – $1.31 billion Fear & Greed Index – 80 (Extreme Greed)
Volume – $61.48 million Green Days – 17/30 (57%)
Sentiment – Bullish RSI – 61.67
Volatility – 15.28% 20-Day EMA – $3.88
According to our technical analysis, the Ronin crypto price is forecasted to drop 10.81% to reach $3.81 by April 02, 2024. The fear and greed index is 80 (Extreme greed), and the volatility is 15.28%. The RON price has performed positively for 17 days in the last 30 days, indicating buyers’ grip.
Ronin Crypto Price vs Volume Analysis
The trading volume has decreased from $170 million to $61 million, but the price has not significantly declined. Due to the fall in the trading volume, the RON crypto price may react negatively. If the volume increases, it may hold near the $4.50 mark.
Ronin Crypto Social Dominance and Social Volume Analysis
According to the chart, the interaction about RON crypto on social media has decreased for the last few weeks, and the price has also declined, but it recovered later. If social dominance and volume increase, it may positively impact the price.
Ronin Crypto Price Has Formed Double-top Pattern on Daily Timeframe
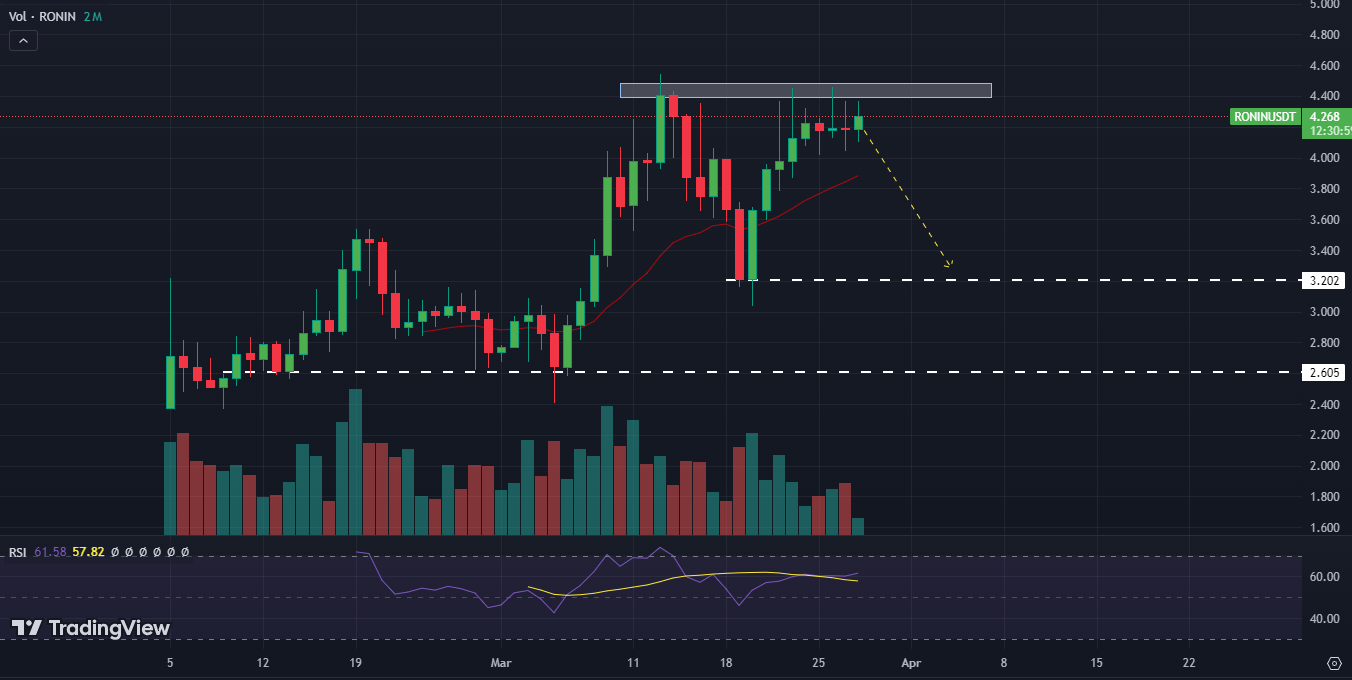
The RON crypto price has faced resistance from the $4.50 mark, so profit booking took place. The price has been attempted again and reached the last swing high.
The Ronin price has formed a double-top pattern on a daily time frame. If the RON crypto price faces resistance from $4.50 and declines, then selling pressure can be expected. If the price slips below the neckline of $3.20 and sustains, then sellers may look for a new all-time high.
On the other hand, if the RON price surpasses the resistance level of $4.50 and sustains, buying momentum for the long term can be expected.
Based on the technical indicators, the RON price is trading over the 20-day exponential moving average, indicating bullish momentum. The RSI is at 61, and a bullish crossover has been generated between the RSI and the RSI-based moving average.
Conclusion
The Ronin price has been bullish and rising by forming higher highs and higher lows. The price is struggling below the $4.50 mark, and sellers seem to be active there. Last time, the price faced resistance from the $4.50 and declined by 30%. The price has extended to the resistance level of $4.50 and is consolidating. If the price slips below the 20-day exponential moving average, selling pressure for the short term can be expected.
Technical Levels
Resistance: $4.50 & $5.00
Support: $3.20 & $2.60
Disclaimer
This article is for informational purposes only and provides no financial, investment, or other advice. The author or any people mentioned in this article are not responsible for any financial loss that may occur from investing in or trading. Please do your research before making any financial decisions.




