
 astronaut
 Pearl
Pearl Zylo Ecosystem
 Bitcoin
 Bitway
 NEAR Protocol
 Zcash
Zcash
- The 24-hour trading volume has increased by 50%.
- The Arbitrum crypto price has formed an exciting chart pattern on the support level.
Since October 2023, the Arbitrum price has performed positively and recorded a new all-time high of $2.40 on January 11, 2024. In the first week of January, the ARB price faced resistance from the $2.40 mark and lost around 25% in just 10 days.
Moreover, it attempted again in March to record a new all-time high, but profit booking saw the price decline by more than 50% till now. Per the chart structure, the price has declined due to resistance from the 20-day exponential moving average.
Based on the technical indicators, the Arbitrum coin price is trading far below the key moving averages, which indicates a negative forecast. RSI is 35 and consolidating near the oversold zone. The technical indicators favor the bearish sentiment at the press time.
Token Unlock Project
8 Big Projects Unlock Tokens This Week | May 13 – 19
— iCryptoAI (@iCryptoAI) May 13, 2024
Track Smart Money's action for each token with specific analysis at https://t.co/7yX6uESNZ0
1. $DYDX – $12.39M ~ 2.58% M.cap – May 14
2. $AEVO – $914.53M ~ 752.39% M.Cap – May 15
3. $STRK – $73.75M ~ 8.85% M.Cap – May 15… pic.twitter.com/Mi2WImgahq
According to this source on X (formerly called Twitter), the Arbitrum token is about to unlock on May 16, 2024. After this event, a price decline may occur.
Arbitrum Price Has Formed a Descending Triangle Pattern on Major Support Level
The Arbitrum coin price has formed a descending triangle pattern on the major support level in a daily time frame. Suppose the asset price triggers a breakout from the triangle and upholds over the 20-day EMA; buyers may lift it to the 100-day exponential moving averages.
On the other hand, if the ARB crypto price slips below the major support level of $1, sellers may become confident and lead the trend. Suppose the price fails to defend the $0.85; sellers may eye for a new all-time low.
At press time, the Arbitrum price traded at $1.00 with an intraday gain of 0.43%. The market capitalization is $2.65 Billion, and the 24-hour trading volume is $214.31 Million. The circulating supply is 2,653,939,684 ARB, and the total supply is 10,000,000,000 ARB.
ARB Price Prediction Over 4-H Time Frame
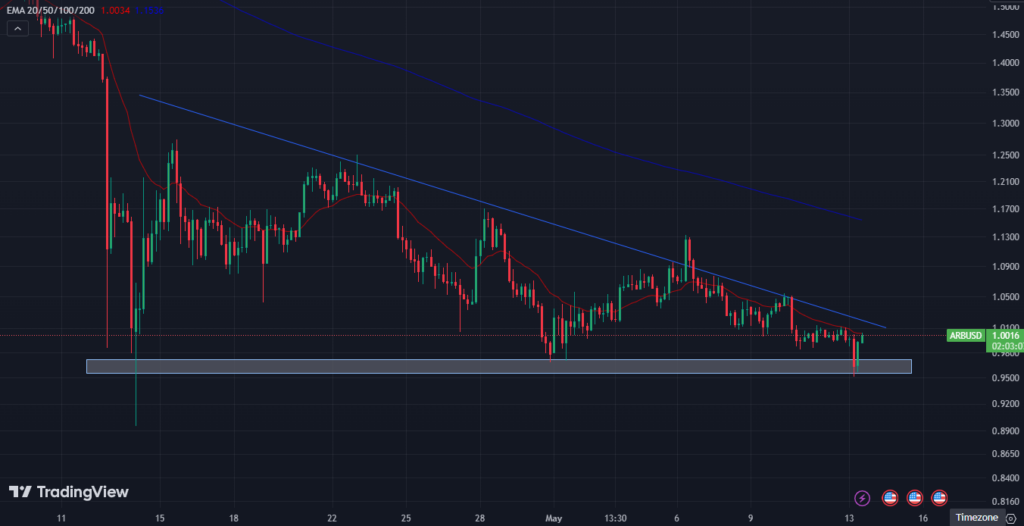
Currently, the Arbitrum coin price has formed a bullish engulfing candlestick pattern on the major support level. If the price exceeds the trendline, buyers may lift the price to the 200-day EMA.
In contrast, if it faces resistance from the 20-day EMA and slips below the last swing low, selling pressure can be initiated.
Conclusion
Based on the technical indicators and the descending triangle pattern formed on the major support level, the Arbitrum price may experience a decline if it slips below the support level of $1. On the other hand, if the price triggers a breakout from the triangle and upholds over the 20-day EMA, buyers may lift the price to the 100-day exponential moving averages.
Technical Levels
The technical chart of Arbitrum crypto suggests that the price may face resistance from the $1.25 and $1.60 levels. Moreover, the asset may take support on the $1 and $0.75 marks.
Disclaimer
This article is for informational purposes only and provides no financial, investment, or other advice. The author or any people mentioned in this article are not responsible for any financial loss that may occur from investing in or trading. Please do your research before making any financial decisions.




