
 Bitcoin
 Pearl
Pearl Starknet
 Zerebro
 NEAR Protocol
 Solana
 Quantus
- An increase of 10.40% has been observed in the BTC crypto price during the weekly trading session.
- The current Bitcoin price is on the verge of a breakout from a bullish flag pattern.
- The 24-hour trading volume of BTC has reached over $15.90 Billion, with a decline of 41.43%.
Bitcoin (BTC) is the first and most influential cryptocurrency in the world. It is a peer-to-peer online currency that allows users to directly send and receive BTC without the need for a traditional finance system.
Bitcoin price has grown so much since September 2023. Especially in Feb 2024, a noticeable upsurge in the crypto price occurred, which resulted in a total shift towards bullish sentiments. At present, the crypto price is looking for new heights.
Will Buyers Succeed in Creating a New All-Time High Level Once Again?
As of Feb 26, 2024, a strong appearance of the investors can be seen in the Bitcoin price. They marched the crypto price by almost 40% to the $73750.07 level, which is serving as an all-time high price level in the current phase. The cryptocurrency price entered a major correction phase afterward.
The price formed a bullish flag pattern during the correction phase, which is keeping the current price inside. However, strong buying has been observed in the BTC price in recent sessions, holding the capacity for a potential breakout. Compared to the last seven days’ data, Bitcoin has outperformed the global cryptocurrency market.
Price Volatility & Social Dominance Analysis
The social sentiments about the BTC crypto have increased since Feb 2024. Bitcoin covered over 30% of social dominance across social media platforms. This reflected an impressive result in crypto price growth, and volatility remains stable under 0.027.
After Apr 22, 2024, a rise in social tweets can be seen in the chart, reflecting the increasing interest of users in the current phase.
Technical Analysis of the Bitcoin (BTC/USD)
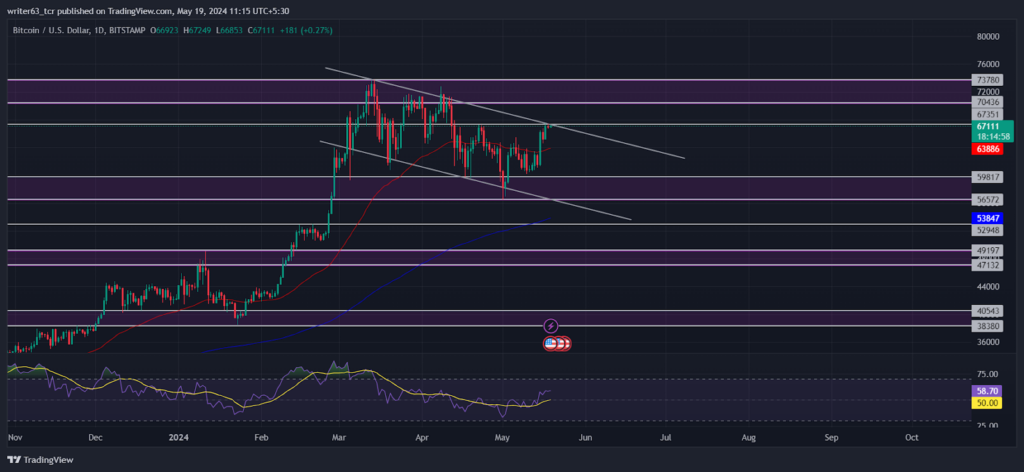
The long-term outlook rests above the key exponential moving averages, reflecting an uptrend. BTC price has rebounded the 50-day EMA, showing an indication of a strong bullish trend continuation.
Bitcoin price has formed a bullish flag pattern after creating an all-time high price level of $73750.07. The price is trading at $67036, moving under the flag pattern.
In recent sessions, the buyers have shown a strong presence from the $56572 decisional point of interest (POI), resulting in an almost 18% upsurge. Regarding the technical analysis, the current price reflects a bullish outlook above the $67351 level.
The relative strength index (RSI) shows strong bullish momentum in the current trading sessions. It indicates the buyers have the upper hand over the price at the moment. The RSI is upsloping at 58.59, above the SMA line.
Summary
The Bitcoin price has been performing under a bullish flag pattern after creating an all-time high mark. However, a strong upsurge in price has occurred in recent sessions, which may lead to a potential breakout of that pattern. The current market speculation suggests a bullish view for the BTC crypto price.
Technical Levels
The immediate resistance level for BTC at the time of writing was $67351, while the $59817 level is the next support. If the price breaks the upper resistance, a rise in price can be expected.
Disclaimer
The views and opinions stated by the author or any people named in this article are for informational purposes only. They do not establish financial, investment, or any other advice. Investing in or trading crypto or stock comes with a risk of financial loss.




