
 astronaut
 Zylo Ecosystem
 Pearl
Pearl Quantus
 Bitcoin
 Sui
Sui Bitway
- The MANTA crypto is following a strong downtrend on the daily chart.
- Higher long liquidation in Manta Network is recorded in the last 24 hours.
Manta Network is a ZK-application platform offering privacy and scalability. It utilizes zk-SNARKs for shielded transactions and leverages layer-2 solutions for high throughput. Its native token, MANTA, powers the network and facilitates governance.
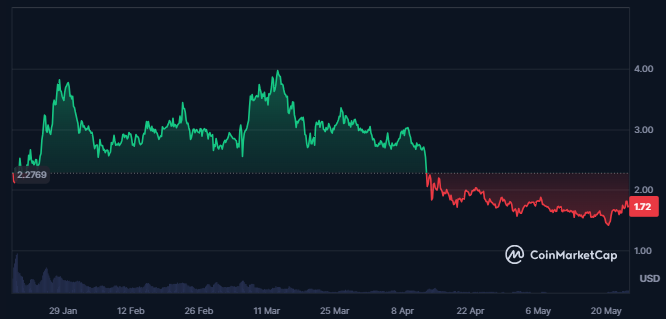
The market cap of the Manta Network crypto is trading flat, resulting in a market cap of $433.31M. Also, the crypto market cap ranking is #164, as per CoinMarketCap.
251.0M MANTA cryptos are circulating in the global cryptocurrency market out of a total supply of 1.0B MANTA. Also, the fully diluted market cap of the crypto is $1.718B.
Manta Network Crypto Derivatives Analysis
A higher long liquidation worth $337.61K was recorded in the crypto over the last 24 hours, followed by a short liquidation of $68.04K.
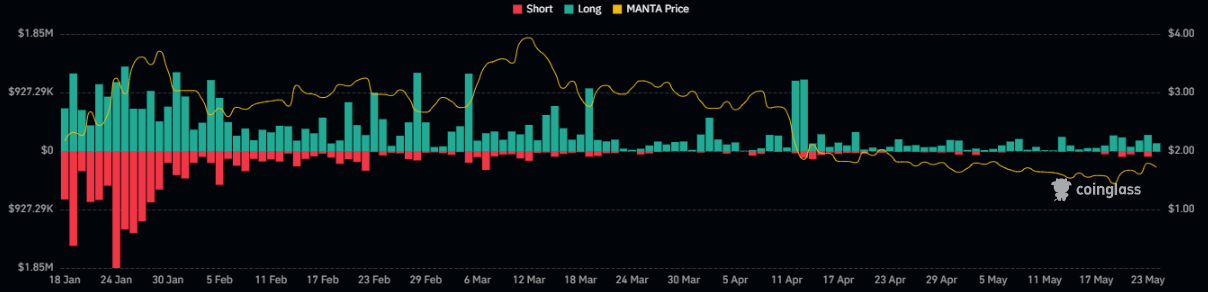
Manta Network Crypto Derivatives Liquidation Chart | Source: Coinglass
Also, a rise in the derivatives activity of the Manta Network can be witnessed as the value of the traded volume for crypto has advanced by 58% in the last 24 hours.
This further results in a traded value of $219.31M while the open interest for the crypto has declined by 5.32%, resulting in $42.63M. Also, the long/short ratio of the crypto is 0.9048.
MANTA Crypto Derivatives Analysis
The MANTA crypto price can be seen consistently declining to lower levels, followed by the formation of lower highs on the daily crypto chart. This shows a strong downtrend in the trading price of the crypto.
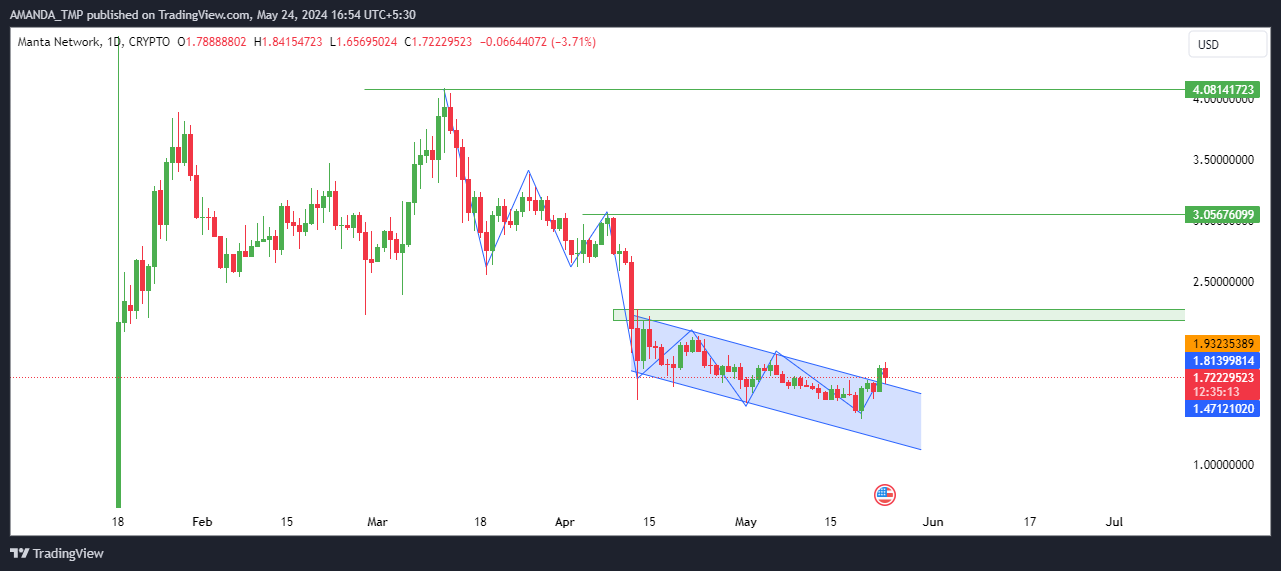
Also, the most recent price action shows that the recent decline in the crypto price led to the formation of the falling wedge pattern, and the crypto price further has broken out above the same.
Despite the breakout in the crypto’s trading price, the crypto price seems weak as a strong resistance level is situated at the level of $2.250. Until the crypto price breaks above the given level and sustains above the same, the sentiment of the crypto is expected to stay bearish.
MANTA/USD Chart by TradingView.com
The price of the MANTA crypto was trading below the 50-day EMA plotted on the daily crypto chart. This showed a weakness in the crypto trend and further indicates the possibility of a further decline in trading prices.
The MACD was also uncertain on the daily crypto chart, as the MACD and the signal line were trading in a bullish cross but were in negative territory.
The RSI on the daily crypto chart has hit the level of 50 and has broken above the 14-day SMA. If it further sustained above the 50-level, a surge in the momentum of the crypto might be seen.
Summary
MANTA crypto follows a strong downtrend, with higher long liquidations and consistent lower highs.
Despite a breakout above a falling wedge, it faces strong resistance at $2.250, trading below the 50-day EMA. MACD and RSI indicators suggest uncertainty, indicating continued bearish sentiment and the potential for further price declines.
The resistance level for the crypto on the higher side is between $3.05 and $4.08, while the support levels for the crypto are $0.50 and $1.30.
Disclaimer
This article is for informational purposes only and does not provide any financial, investment, or other advice. The author or any people mentioned in this article are not responsible for any financial loss that may occur from investing in or trading. Please do your research before making any financial decisions.




