
 Pearl
Pearl Zylo Ecosystem
 Starknet
 Walrus
 Sui
Sui Bitway
 Pons
Pons
- Avalanche price has slipped to the $25 mark, noted a range breakdown this week.
- Sellers have looked confident and willing to push the token toward the $20 mark.
Avalanche (AVAX) price is in a downtrend. It slipped below its key moving averages, reflecting underperformance over the past few trading sessions.
For more than two months, AVAX stayed in a closed range between $30-40 and did not showcase any impulsive moves.
Following the breakdown, the technicals indicate that AVAX is trading at its make or break zone of $25, which if it holds, buyers may retain strength. Conversely, if it fails to do so, AVAX will likely retrace the gains below the $20 mark and might reach $15 soon.
At press time, Avalanche price was at $25.20 with an intraday decline of 4.36%, reflecting neutrality on the charts. It has a monthly return ratio of -36.20% and 100.20% yearly, reflecting short term bearishness.
The pair of AVAX/BTC is at 0.000394 BTC, and the market cap is $9.97 Billion. Analysts are neutral and suggest that the AVAX price may continue to face bearishness and might slip toward the $20 mark soon.
Avalanche (AVAX) in Trouble: More Downside on the Cards?
The Avalanche (AVAX) price fell below the major support level of $30, displaying a death crossover.
Source: TradingView
For weeks, the token had been in a consistent downtrend and reflected underperformance on the chart. Amidst the market volatility, the token witnessed only selling pressure and no buying, highlighting a sharp decline of over 40% last month.
The Momentum Indicator (RSI) curve is in the oversold region and plotted a negative divergence on the charts. Similarly, on an analysis over 26 indicators, 16 indicators have guided a sell call, while 10 were displayed neutral.
Meanwhile, none of the indicators have guided a buy signal, which means that AVAX token was in a severe downtrend and further downside can be seen ahead.
What do Price Volatility and Weighted Sentiment Data Indicate?
The price volatility curve spiked over 132% to the 0.032 mark.
Source: Santiment
Nonetheless, the weighted sentiment data witnessed sharp fluctuations and dropped below the midline region, reflecting a negative outlook.
AVAX’s Social Metrics Reveals Positive Outlook
Despite the price drop, the social dominance curve reveals a surprising rise and surged over 234% to 1.25%, displaying the increment in the users’ engagement on social media platforms.
Source: Santiment
Meanwhile, its development activity data revealed the average moves and stayed below the midline region.
Futures OI Data Reveals Short Additions
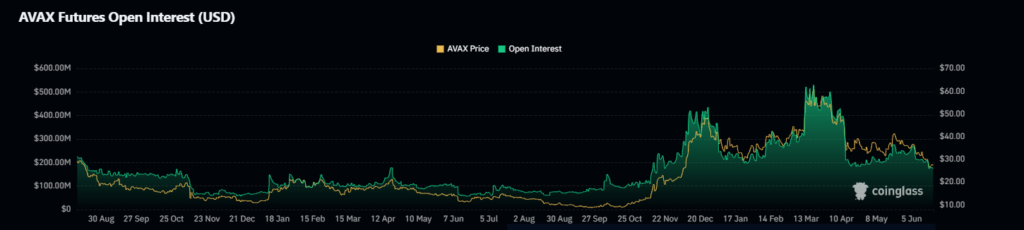
The Futures OI data highlights seller dominance, while the bear army persisted in adding short positions.
Source: Coinglass
The open interest data reveals a surge over 14.20% to $203.52 Million in the last 24 hours, indicating sharp short buildup activity. The immediate support levels for the AVAX token are $23.20 and $20, whereas the key upside hurdle is around $28 followed by $30
Will AVAX Retest Further Lows Ahead?
AVAX is below the key moving averages and revealed underperformance on the charts. Meanwhile, the token slipped to its make-or-break support zone of $25, giving a negative outlook.
Disclaimer
This article is for informational purposes only and provides no financial, investment, or other advice. The author or any people mentioned in this article are not responsible for any financial loss that may occur from investing in or trading. Please do your research before making any financial decisions.




