
 no crying in the casino
 NEAR Protocol
 Starknet
 Pyth Network
 Pearl
Pearl Quantus
 Pudgy Penguins
- Celestia (TIA) displayed a massive selloff and reached the 52-week low of $5.
- Sellers continued to dominate and persist in pushing the token to the lows.
TIA witnessed selling pressure, reaching the yearly low mark of $5 this week. However, the buyers managed to secure the $5 mark and defended the 23.6% Fibonacci support zone.
Meanwhile, the sellers looked aggressive and persisted in adding short positions, which pressured the bulls to handle the gains.
Trading below the significant moving averages, TIA token displayed a severe decline from the top of $20 and lost over 80% of its gains in the last three months.
A rounding top formation was observed, the breakdown of which was noted last month. The token looked oversold and does not have much room to drain further.
At press time, TIA was trading at $5.75 with an intraday surge of 3.29%, reflecting neutrality on the chart. It has a monthly return ratio of -48.30% and 85.30% yearly, reflecting a downtrend.
The pair of TIA/BTC is at 0.0000932 BTC, and the market cap is $754.32 Million. Analysts are bearish and suggest that the TIA may replicate a rebound and could attain a reversal soon.
Celestia (TIA) Looks Oversold: Is a Bounce Imminent?
For the past few months, Celestia token has revealed underperformance and continued to lose the gains. Amidst the market bloodbath, TIA was among the worst hit, it dropped over 70% from the highs.
A break and close above the 20-day EMA mark could stretch the rebound toward the $7 mark. Meanwhile, $8 is the make-or-break zone, which is the severe resistance mark.
TIA Price Chart | Source: Santiment
The traditional indicator, the RSI curve, witnessed a pullback from the oversold region, noted at 36. In contrast, the MACD indicator showed a convergence on the signal line with the MA line.
A death crossover was observed, and the falling moving averages reflected a decline. Further decline is unlikely unless the token breaks and closes above the $7 mark.
Decline in Social Dominance and Weighted Sentiment
Per the Santiment data, the social dominance data displayed a decline, noted at 0.098%, revealing the decreasing investors’ interactions on the social media platforms.
Social Dominance Data | Source: Santiment
Similarly, the weighted sentiment observed a consistent decline, noted at -0.527, signifying reduced demand and investors’ interest in the token.
Amidst the price rise, the crowd sentiment value stayed in the positive region, noted at 0.072, articulating the optimistic outlook among the investors.
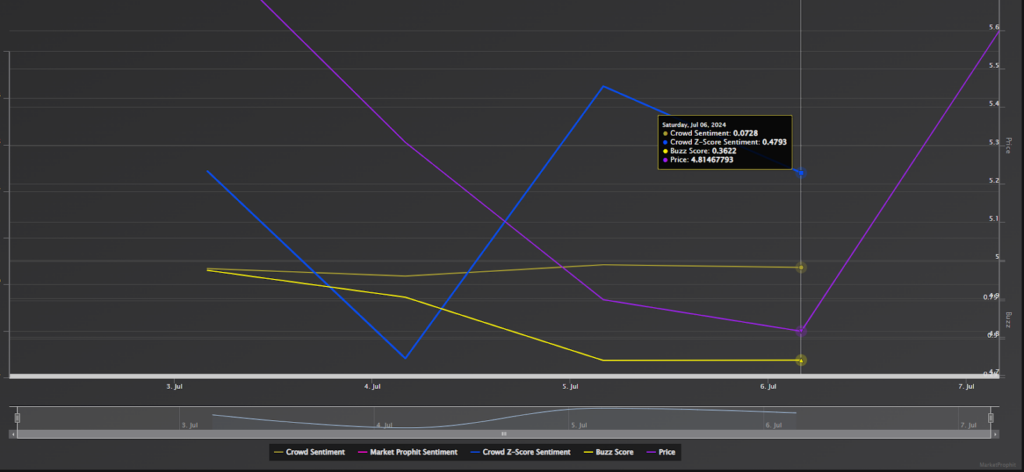
Likewise, the buzz score of 0.3607 suggests the token has the potential to expand the gains. @Nebraskangooner, in his tweet, said that TIA is set for a pullback and could reach the $7 mark soon.
$TIA
— Nebraskangooner (@Nebraskangooner) July 6, 2024
If it can reclaim $5.30 area on daily then it has a chance to push back to $7.00 area pic.twitter.com/aXzInzXHM5
A Tweet by Nebraskangooner | Source: X
TIA Total Liquidations Chart Analysis
Over the past few sessions, a sharp surge in long liquidations was noted. At the time of writing, the long liquidation volume was $88.39k, surging over 40% in the last 24 hours.
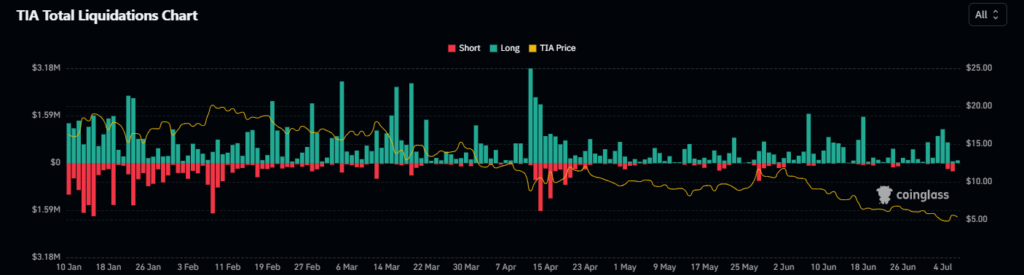
Meanwhile, the short liquidations were noted at $10.30k, reporting an overnight decline of over 46%. This liquidation data signifies the selling pressure was still intact.
The immediate support levels for TIA are $1.80 and $1.30, whereas the key upside hurdle is around $2.40, followed by $3
The TIA token price stayed below the 20-day EMA mark and looks bearish on the charts. Until the token climbed above it, sellers continued to dominate the battle.
Disclaimer
This article is for informational purposes only and provides no financial, investment, or other advice. The author or any people mentioned in this article are not responsible for any financial loss that may occur from investing in or trading. Please do your research before making any financial decisions.




