
 Pearl
Pearl Zylo Ecosystem
 Bitway
 Walrus
 Starknet
 Quantus
 Pudgy Penguins
- The BTC price surpassed the 200-day EMA and faced the $59K hurdle.
- Bitcoin ranks 1st in the cryptocurrency market in terms of market capitalization.
After reaching an all-time high in mid-March, the BTC price showed weakness for 5 days and lost 15%. The Bitcoin price has attempted 4 times to overcome the $71.50K hurdle, but sellers were strong enough.
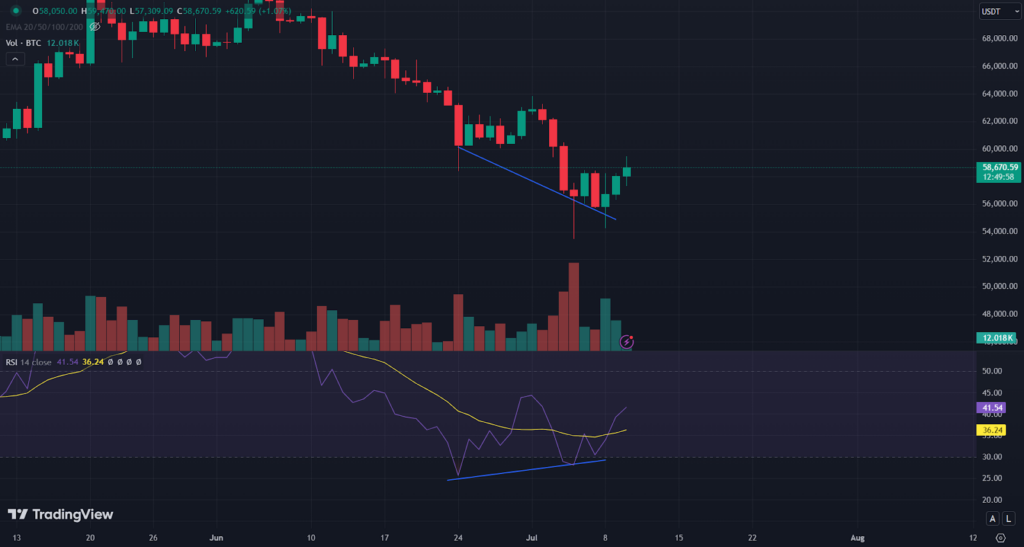
The BTC price formed an ‘evening star’ candlestick at the top in the first week of June and declined by more than 20% in a month. After a bearish momentum, the price has climbed back over the $59K hurdle.
At press time, Bitcoin was trading at $58.47K with a neutral momentum for the past 24 hours. The market capitalization was $1.15 Trillion, which ranks 1st in the cryptocurrency market. The 24-hour trading volume was $27.44 Billion.
Bullish Divergence
Source: By TradingView
The RSI has generated a bullish divergence in the daily time frame, which might signify a trend reversal. Relative Strength Index (RSI) has shown its potential and defended its last swing low despite weakness in the BTC price.
RSI has generated a golden crossover with the RSI-based moving average. RSI is 41 and heading for the overbought zone.
Liquidity Below $60K Grabbed; Will BTC Price Soar Now?
On a daily time frame, the Bitcoin crypto price has slipped below the major support level of $60K. However, buyers have participated and have surpassed the 200-day EMA.
Sellers seem to have been grabbed below the 200-day exponential moving average and are ready to shoot up. Buying momentum can be seen if the trading volume increases while entering the $60K hurdle.
On the other hand, if the digital asset price sustains below the $60K level, sellers may remain strong. Assuming the price starts trading below the $52K mark, intense selling pressure can be experienced.
Based on the technical indicators, the Bitcoin price has surpassed the 200-day EMA and is heading for the 20-day EMA. RSI has shown bullish divergence and golden crossover. Overall, the technical indicators are in favor of a bullish forecast.
Bitcoin Forecast on Deep Analysis
A source on X says that, after analysis of the BTC price chart for 2 days, he claims this could be at the bottom. 68.4K BTC is going out from the exchange, and the last time this was repeated in July and November 2022.
I've analysed the market over the past
— Ash Crypto (@Ashcryptoreal) July 10, 2024
2 days and this could be BTC bottom.
I've compiled some TA and FA.
Read below!
1. Bitcoin Netflow in Exchanges
There's 68.4k $BTC going out of exchanges. This large amount was last seen in July and Nov 2022.
2. Wyckoff Method
Bitcoin… pic.twitter.com/klDZYgjjof
Due to the huge liquidity grab, a spike in price has been seen. This rate of change was seen in March 2023. In the U.S. election in 2024, Donald Trump has a winning chance of 85%, and he seems to favor cryptocurrency according to the sources on X.
In three consecutive weeks, the BTC ETF has shown positive inflow. The BTC price has formed a flag and pole pattern and is expected to gain momentum after the breakout.
Bitcoin Price May Rebound or Melt to $55K?
BTC price performed negatively after reaching an all-time high. It has bounced back over the $59K mark after getting liquidity. The RSI favors strong bullish momentum by generating bullish crossover and divergence. The Bitcoin price was bullish at press time and has shaped a higher low.
Technical Levels
Bitcoin price is expected to face resistance from the $64K and $71.50K levels. The price may take support at $50.50K and $42K levels.
Disclaimer
This article is for informational purposes only and provides no financial, investment, or other advice. The author or any people mentioned in this article are not responsible for any financial loss that may occur from investing in or trading. Please do your research before making any financial decisions.




