
 Bitcoin
 Pearl
Pearl Starknet
 Zerebro
 NEAR Protocol
 Solana
 Quantus
- The price of the Fantom crypto is up by 24000% from its all-time low.
- An advance in the token incentives of FTM was recorded on the Token Terminal.
A surge in the derivatives activity of the Fantom token ecorded as per Coinglass followed by a surge of 20% in the derivatives trading volume.
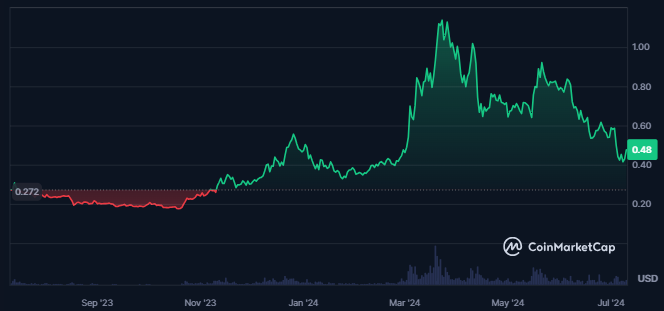
Fantom crypto has a strong market presence with a market cap dominance of 0.06%. Despite this, the token volatility stands at 12.88%. This indicates higher chances of uncertain spikes in the price.
The supply inflation of the crypto is also very low at 0.17% which is very good for the long-term growth of the crypto. This is followed by a circulating supply of 2.803 Billion FTM and a fully diluted market cap of $1.510 Billion.
At press time, 57% of the holders of the token are in a loss while 38.92% of the holders of the token are sitting in profit. Additionally, Fantom crypto has a total of 172.61 Million holding addresses.
Fantom Crypto Blockchain Data Overview
Monthly active users for the token recorded by the Token Terminal in the last 30 days surged 72% to 590.1K.
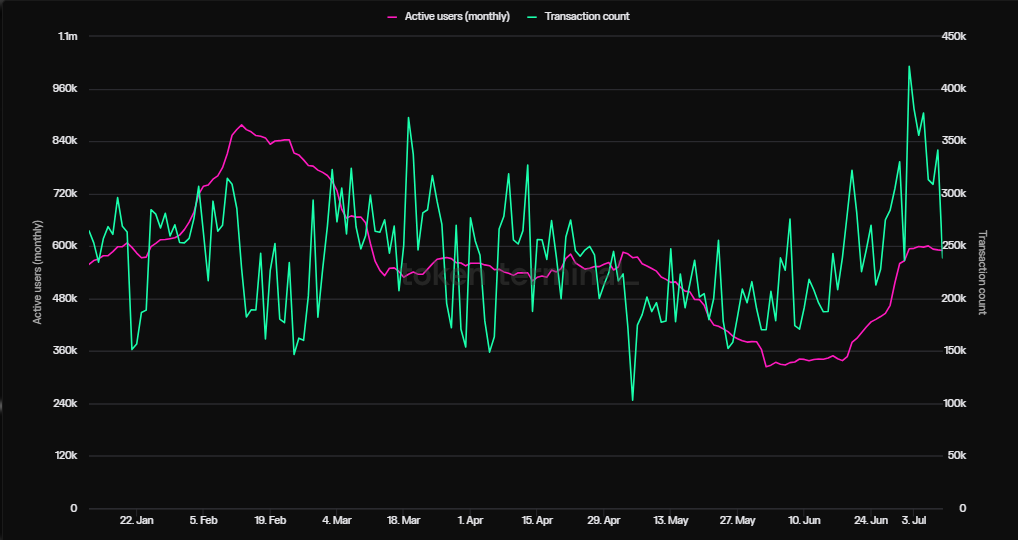
Following the surge in the number of active users, a rise in transaction count was recorded. This shows a sharp demand for the token’s protocol among users. Additionally, a few days ago, Fantom topped with 594.2K transactions in a day.
FTM Token Technical Analysis
On the daily chart of the FTM token, the price displayed a consistent sell-off over the last few months.
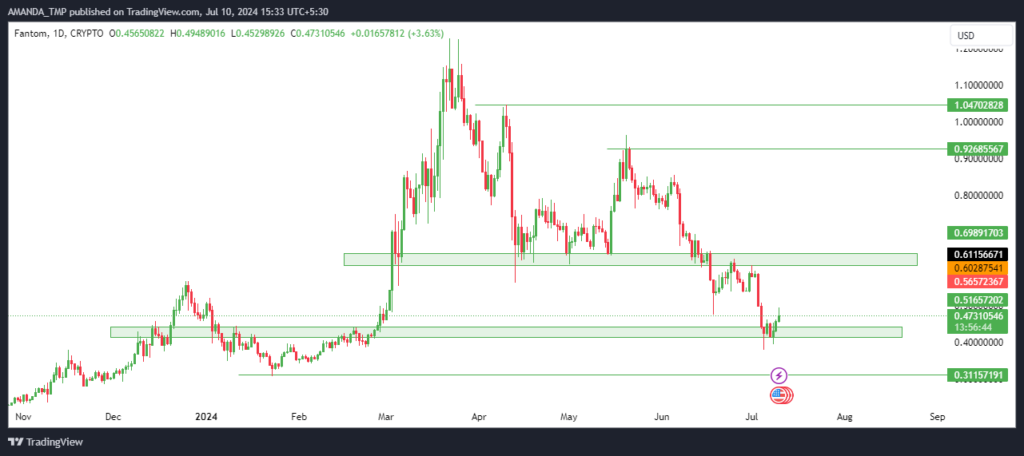
The token formed lower lows on the chart, highlighting a strong downtrend. The price has declined below crucial levels and took support at a non-mitigated swing level.
There are strong resistance levels at the higher levels. If the token surges, it might face resistance. If the price break the $0.65 resistance and sustains above the same, a continuation in price to the higher levels could be seen.
FTM/USD Chart by TradingView
Technical indicators on the chart display a bearish trend. This is followed by the crucial EMAs trading in a death cross. FTM has also declined below the 50-day and the 200-day EMAs.
The MACD metrics have been trading in negative territory for a long time and sustained below the same. The RSI has lost momentum following a bearish cycle and was at 40.41 at press time.
The Fantom token shows mixed signals despite impressive long-term gains and rising user activity. Low supply inflation and rising derivatives volume indicate potential, yet technical analysis highlights strong resistance and bearish trends, suggesting price volatility and uncertainty about future highs. Caution is advised for investors.
Disclaimer
This article is for informational purposes only and does not provide any financial, investment, or other advice. The author or any people mentioned in this article are not responsible for any financial loss that may occur from investing in or trading. Please do your research before making any financial decisions.




