
 Pearl
Pearl Walrus
 Starknet
 Quantus
 Bitway
 Sui
Sui Zylo Ecosystem
- Solana (SOL) price is 28300% above its all-time low price.
- SOL volatility is medium at in 4.59%.
The sentiment of Solana is neutral, as per the analysts, and the maximum supply of the token is infinite. The token’s circulating supply is 463.962 Million SOL, followed by a total supply of 579.994 Million SOL.
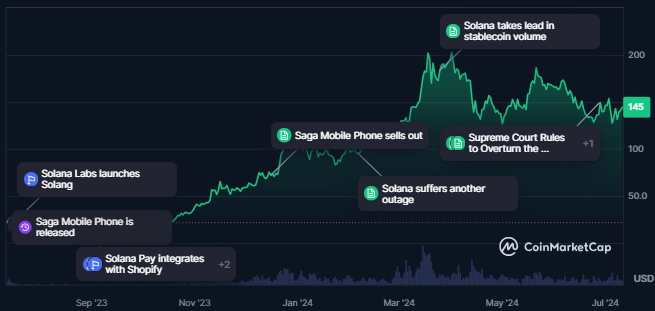
Price and Event Chart Of Solana | Source: CoinMarketCap
The token’s market cap has been trading flat over the last 24 hours, followed by a market cap value of $67.08 Billion. This makes it the 5th largest cryptocurrency in the global crypto market.
Additionally, the value of the traded volume of the token is worth $1.8 Billion in the last 24 hours from the press time, as per CoinMarketCap. Also, the market cap dominance of the token is 2.97%, and the sentiment of the token is neutral.
Solana Token Unlocks Overview
Solana’s 89.56% of the tokens are unlocked, resulting in 662.73 Million SOL and 77.27 Million Solana tokens still being locked.
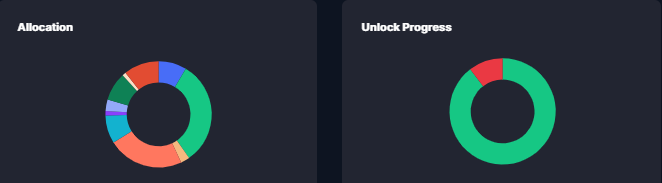
Allocation and Unlock Progress | Source: CoinMarketCap
The fully diluted market cap of the token is worth $83.186 Billion, and 8.53% of the token supply is distributed among Solana’s team.
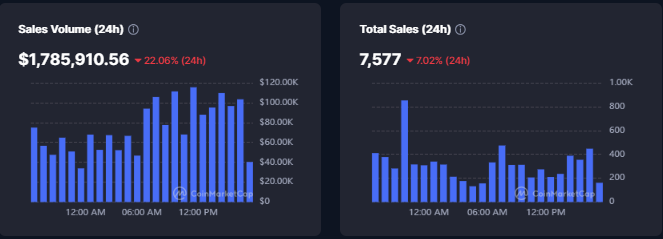
Sales Volume and Total Sales Chart | Source: CoinMarketCap
The sales volume of the token has recently declined, following which a decline in the total sales is also recorded. This might lead to a further decline in the token’s revenue.
The supply inflation of the token is also certainly high, which has resulted in 11.66%. The sentiment of the token is neutral, and the fear and greed index is at 29, which shows fear among the investors.
SOL Token Technical Analysis
SOL recently broke below a strong trendline, a pattern that has been recurring for over six months.
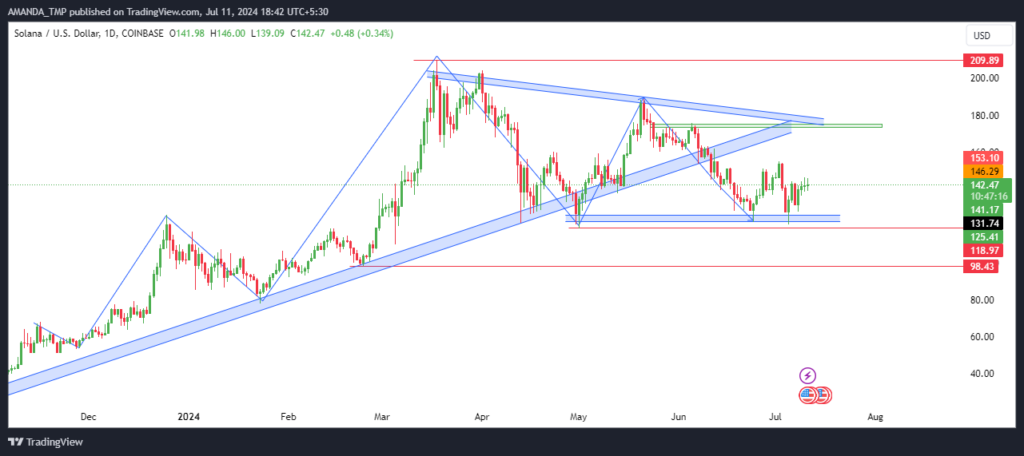
SOL Crypto Daily Price Chart | Source: TradingView
Despite this decline, the SOL showed resilience by rebounding from the existing swing low, advancing by 20%. This rebound indicated a potential market sentiment shift, suggesting buyers are stepping in at lower levels.
The most recent price action on the chart reveals the formation of an inside candle, following four consecutive green candles on the daily chart. This pattern indicates a period of consolidation and potential uncertainty in the market.
SOL/USD Chart by TradingView
SOL has been trading below its 50-day EMA, reflecting short-term bearish pressure. This downward trend indicates that sellers dominate the market in the short term.
Despite this, the 50-day and 200-day EMAs produced a golden crossover for an extended period, suggesting a long-term bullish sentiment.
MACD shows a bearish cross and is bearish. However, the RSI has recently broken above the 14-day SMA and advanced to 50.48 on the daily chart. This movement shows increasing buying momentum in SOL.
If the RSI further breaks above the 50 level and sustains this position, it could signal a potential shift towards bullish momentum. SOL surged 28300% above its all-time low. The price has rebounded by 20% despite breaking below a strong trendline.
Technical indicators show mixed signals, with a neutral sentiment overall. The market awaits further developments, especially with the potential impact of the upcoming Solana ETF.
The support levels for SOL are 98.0 and $119.0, followed by the resistance levels of $175.0 and $210.0.
Disclaimer
This article is for informational purposes only and does not provide any financial, investment, or other advice. The author or any people mentioned in this article are not responsible for any financial loss that may occur from investing in or trading. Please do your research before making any financial decisions.




