
 Walrus
 Bitcoin
 Quantus
 Pearl
Pearl Quant
Quant Pudgy Penguins
 Sui
Sui
- A surge in the derivatives trading volume of the XRP coin was recorded.
- XRP has massive liquidity based on its market cap.
XRP coin had a circulating supply of 55.805B XRP, which was 55% of the maximum supply of the coin. That resulted in a fully diluted market cap of $61.892B, and its maximum supply is 100.0B XRP.
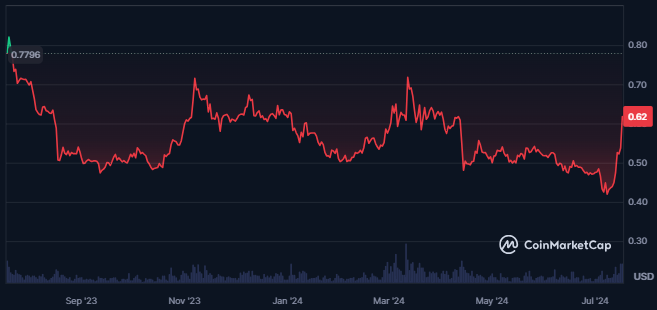
Price Overview Chart of XRP | Source: CoinMarketCap
The XRP coin was the seventh largest cryptocurrency in the global crypto market at press time. It represents a solid market presence with a market cap dominance of 1.42% and a market cap of $34.12B.
The sentiment of the XRP crypto was bullish, as per the analysts. XRP’s Fear and Greed index was at 69, showing greed among the traders and investors. The price volatility of the coin was also high at 6.72%.
The coin’s volume/market cap ratio has been 10.02%, showing huge liquidity. Besides, a considerable surge of 44% in the traded volume of the coin was recorded.
Additionally, the value of the traded volume for the coin in the last 24 hours was $3.452B at press time. Its market cap also advanced by 12.9%, showing a strong surge in the demand for the coin.
XRP Coin Derivatives Data Analysis
The open interest of the XRP coin has advanced by 26% in the last 24 hours, followed by the open interest of the options, which also advanced by 15%. Also, the value of the options open interest of the coin was $290.99K.

XRP Crypto Derivatives Open Interest Chart | Source: Coinglass
The value of the derivatives trading volume of the coin has advanced by 56% to $5.41B. Despite this, the options volume of the coin has declined by 46.5%.
Moreover, higher short liquidations have been recorded in crypto over the last 24 hours, resulting in a value of $3.77M. Also, the longs liquidated for the coin were worth $971.58K. That indicated the dominance of buyers in the XRP coin price.
XRP Coin Technical Analysis
The XRP coin’s price declined below the long-term consolidation, indicating a solid bearish dominance.
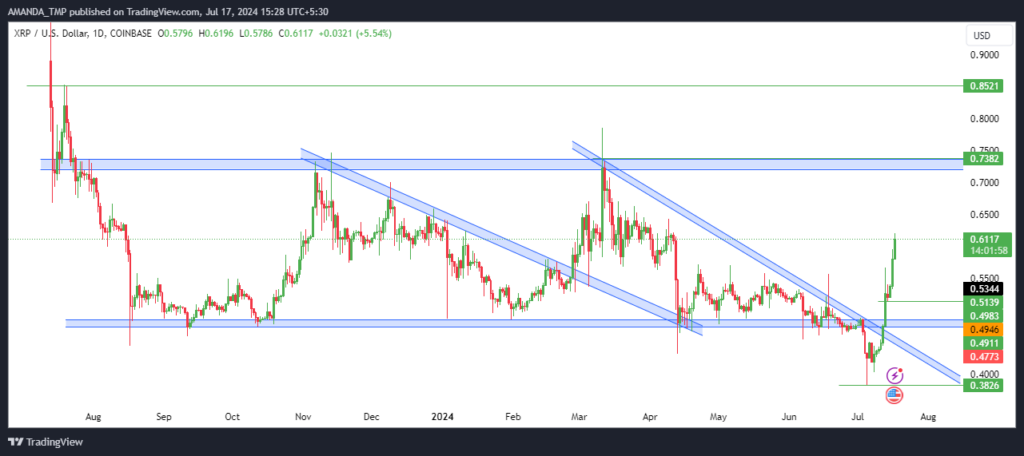
XRP Coin Daily Price Chart | Source: TradingView
Despite the decline below the consolidation, the price rebounded to higher levels.
A dynamic trendline was also formed on the higher side, broken out with strong bullish candles. It showed that the bullish sentiment of the investors and traders dominated the price.
XRP/USD Chart by TradingView
The XRP crypto price has broken above the 200-day EMA, while the 50-day EMA traded below the 200-day EMA. As the momentum of the coin price was strong, if the price continued rising, we might see a golden crossover in the future.
The MACD and the signal line traded in a golden crossover and advanced to a bullish trajectory. The histograms also supported a bullish momentum, followed by the rising height of the histogram.
The RSI broke above the 50 level and advanced to the overbought zone. It also crossed the 14-day SMA, and the price has remained above that.
The XRP Price Broke Above the 200-day EMA
XRP displayed solid bullish momentum with a 12.9% market cap increase and high liquidity.
It rebounded from a bearish trend, breaking above the 200-day EMA.
Bullish indicators include a potential golden crossover, positive MACD, and the RSI in the overbought zone, suggesting continued upward movement toward $1.
The support levels for the XRP coin at the time of writing were $0.3820 and $0.510, followed by the resistance levels of $0.730 and $0.850.
Disclaimer
This article is for informational purposes only and does not provide any financial, investment, or other advice. The author or any people mentioned in this article are not responsible for any financial loss that may occur from investing in or trading. Please do your research before making any financial decisions.




