
 Pearl
Pearl Bitway
 Monad
Monad Ondo
Ondo Derive
 Walrus
 Zcash
Zcash
- The Flow token price outperformed by 73% of the top 100 crypto assets in the last 1 year.
- The token has high liquidity based on its market cap.
The market and financial health of the Flow token have been very strong, as per Chain Broker, which has a rating of 9.53/10.
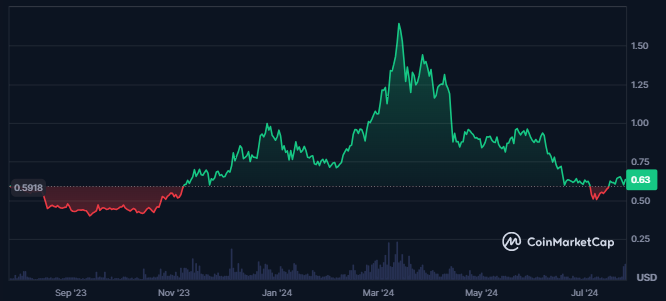
The Flow token’s spot trading volume value witnessed a surge of 365% in just the last 24 hours. This showed strong demand and rising interest of investors for the token.
The token’s market cap value is $960.042M, and its market cap ranking is #70, according to CoinMarketCap. Also, the token’s traded volume value was $150.841M, resulting in a volume/market cap ratio of 15.68%. It showed good liquidity in the token.
The token’s circulating supply has equaled its total supply, while its maximum supply is infinite. Also, the token’s circulating supply was 1.511B FLOW, and the fully diluted market cap was $961.096M.
What Does Flow Token Derivatives Data Indicate?
Despite the token’s market cap rise in the last 24 hours, a higher long liquidation in the Flow token has been recorded.

The Flow token open interest has been very low for a long time and has not witnessed any significant change over a long time. Despite this, over the last 24 hours from the time of writing, a surge of 65% in the open interest of the token was recorded.
The token’s derivatives traded volume value has also advanced by 847%, showing a huge rise in the interest of traders for the token’s derivatives.
The derivatives data exhibited an uncertain outlook for the trend of the Flow token price.
FLOW Token Technical Analysis
A strong downtrend on the Flow token’s chart can be seen as a strong lower-low structure was formed on the token’s daily chart.
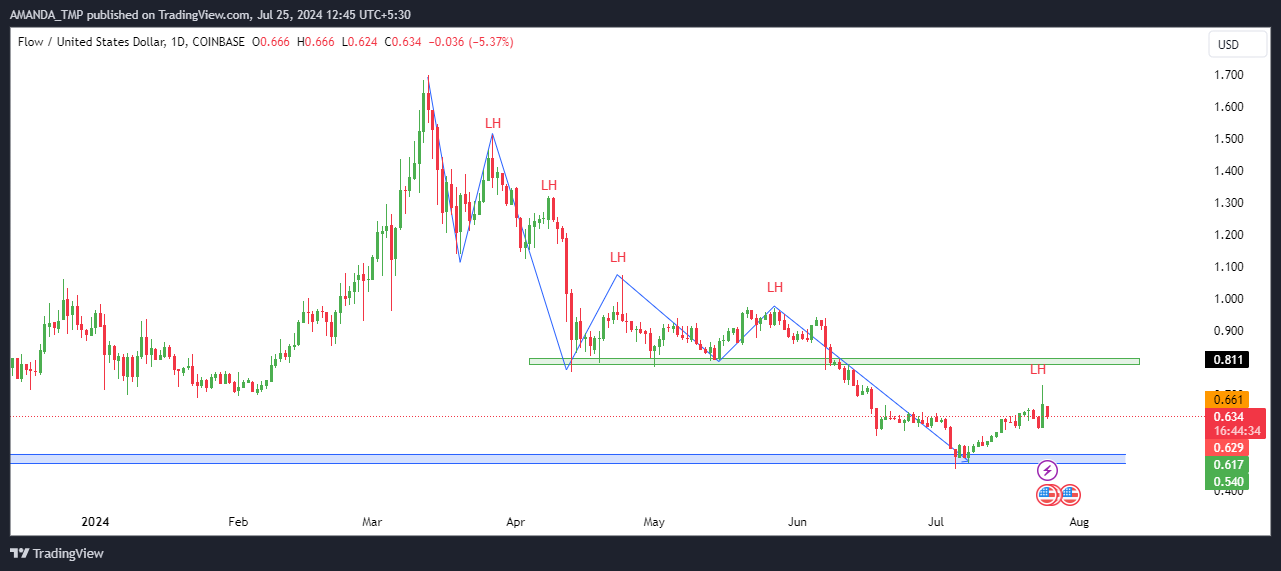
From the swing high of $1.698, the token’s price declined by 70%, which caused the market’s structure to become bearish.
The FLOW token price has taken support at the lower levels and has advanced by 40% from the swing lows. Despite this price surge, the overall structure remained unchanged.
FLOW/USD Chart by TradingView.com
The Flow token price has declined below the 50-day and the 200-day EMA. Following this, the following EMAs also traded in a death cross.
The MACD line advanced above the zero level while the signal line traded below the negative territory.
The RSI has advanced above the 50-level and has sustained above the same, followed by the breakout above the 14-day SMA. This exhibited a bullish momentum in the token’s price.
Flow Token witnessed a Major Surge
The Flow token has seen a significant surge in trading volume and market cap, indicating strong investor interest.
Despite recent bullish indicators like rising RSI and MACD, the token remained in a bearish overall structure with high long liquidations and low open interest. This suggested an uncertain future trend.
The support levels for the FLOW Token price have been $0.40 and $0.590, followed by the resistance levels of $0.90 and $1.30.
Disclaimer
This article is for informational purposes only and does not provide any financial, investment, or other advice. The author or any people mentioned in this article are not responsible for any financial loss that may occur from investing in or trading. Please do your research before making any financial decisions.




