
 Dacity Coin
 Zcash
Zcash Sui
Sui Injective
 Quantus
 Pearl
Pearl NEAR Protocol
- Less than 14% of the Jupiter token supply has been in circulation.
- Jupiter has witnessed a huge surge in TVL in the last few days.
In the last 1 month, the Jupiter token price has advanced by 26%, and at press time, it traded at $0.9825.
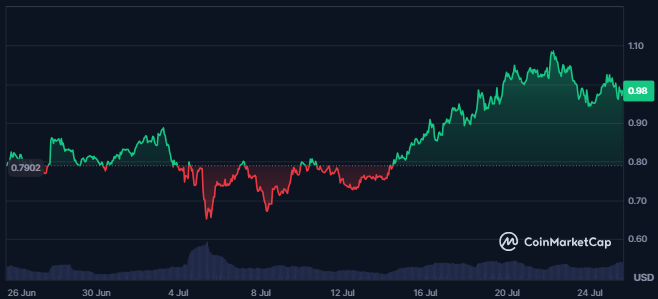
The price has been highly volatile, with a volatility of 11.59%, and its market cap dominance was 0.06%. This represented a strong market presence; the token’s market cap ranking was #58.
The token’s sentiment was bullish, as per the analysts, and its Fear and Greed index was at 68, showing greed among the investors.
The Jupiter token’s market cap value has declined by 1.5% in the last 24 hours. Its market cap value was $1.325B, and the fully diluted market cap was $9.815B.
The traded volume of the token has advanced by 35% in the last 24 hours. It showed a surge in the token’s trading activity and a gain in the interest of traders in the token.
Jupiter Token Derivatives Data Analysis
The value of the derivatives traded volume of the Jupiter token has advanced by 65% in the last 24 hours, resulting in a traded value of $203.03M.

The token’s derivatives volume chart showed consistent advances over the last few days. It indicated a surge in the investors’ interest in the token.
The longs liquidated value was worth $298.13K in the last 24 hours against the shorts of $74.58K. This showed a surge in the sellers’ dominance over the last 24 hours.
The token’s open interest has also witnessed a surge of 10.4%, resulting in a value of $66.09M.
JUP Token Technical Analysis
Following strong momentum, the JUP token’s price has advanced by 55% in the last 15 days.
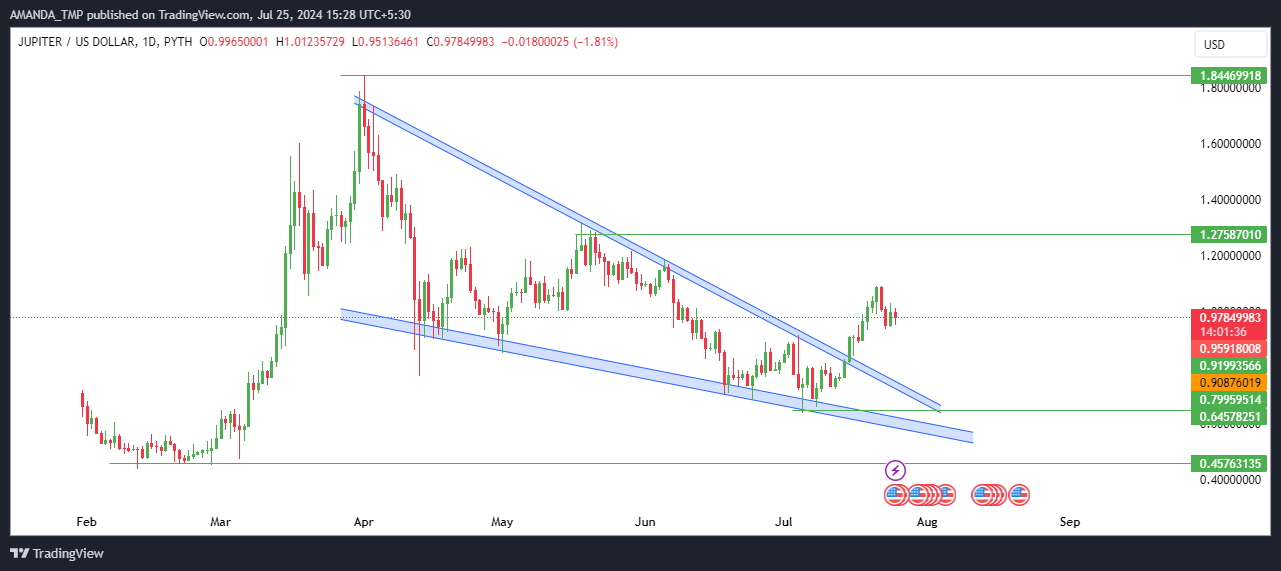
The Jupiter token’s daily chart witnessed a bullish outlook as the token’s price broke out above the descending triangle pattern.
For a long time, the JUP token price declined, followed by a lower low swing on the charts.
Following a strong momentum in the price, the token’s price broke out above the triangle pattern and formed strong bullish candles on the chart.
JUP/USD Chart by TradingView.com
The 20-day and the 50-day EMAs have formed a golden cross on the token’s daily chart. The token’s price also advanced above the EMAs and has sustained above the same.
The MACD and signal line exhibited bullish behavior and advanced above zero. Additionally, both the metrics were trading in a golden cross.
The RSI also followed a bullish cycle and has hit the overbought zone. It showed a rise in the token’s momentum and might lead to higher levels in the price in the future.
Jupiter token price Surged by 26%
The Jupiter token price has surged 26% in a month, trading at $0.9825. With a market cap of $1.325B, bullish sentiment, and increased trading activity, it broke above a descending triangle pattern.
Technical indicators like the golden crossover on EMAs, bullish MACD, and overbought RSI suggest a potential for further gains.
The Jupiter price might take support at the levels of $0.4570 and $0.6450 if it declines to lower levels.
Disclaimer
This article is for informational purposes only and does not provide any financial, investment, or other advice. The author or any people mentioned in this article are not responsible for any financial loss that may occur from investing in or trading. Please do your research before making any financial decisions.




