
 Wisp
Wisp Doge Pepe
 Zylo Ecosystem
 Crawlerpad
 Pudgy Penguins
 Pearl
Pearl Basic Attention
- APT token price has been highly volatile, with a volatility of 8.2%.
- Aptos has strong project fundamentals, according to ChainBroker.
The APT token price witnessed a strong surge in the last few days. It led to an advance of 40% from the most recent swing low of $5.18.
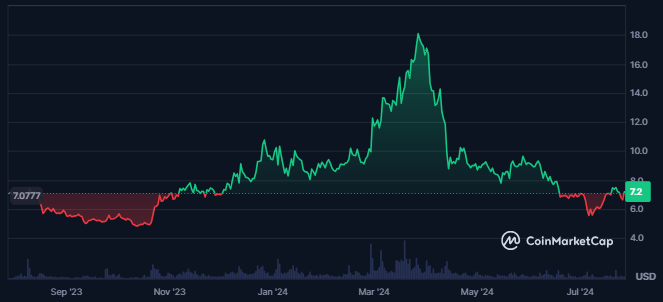
At press time, 1.107B APT tokens were unlocked, and 468.626M APT circulated in the market. Also, the token’s maximum supply was infinite, and the fully diluted market cap was $7.963B.
The token price liquidity was certainly low as the volume/market cap of the token was 2.64%. Additionally, a decline of 19% in the traded volume value was also recorded in the last 24 hours.
With the decline in traded volume, the Aptos token’s market cap advanced by 5.7%, showing a lack of momentum in the price. The token’s sentiment was neutral, and the fear and greed index indicated greed among the investors.
The market cap presence of the Aptos token was very strong, with its market cap dominance at 0.13%. This made it the 27th largest cryptocurrency on the global crypto market.
Social Activity Overview Of the Aptos Token
A decline in the Twitter engagement of the Aptos ecosystem was recorded as per Messari.io.
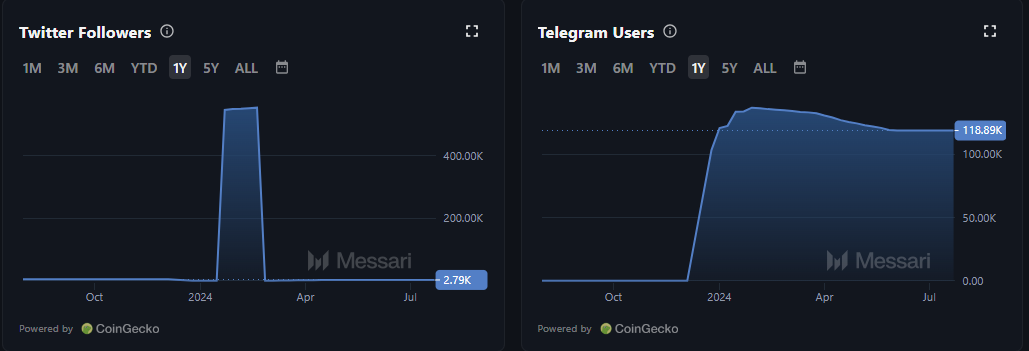
In the last 1 year, Aptos lost many Twitter followers; in February 2024, it had a total of 553.62K followers. The number of followers since then has started to decline, and only 2.79K followers are left.
The following data showed a decline in the token’s social dominance, which showed its declining popularity and interest.
Moreover, the number of the token’s telegram followers has remained intact in the last few months, which has resulted in 118.89K.
APT Token Technical Analysis
The APT token price had formed a higher high swing after consistently declining to lower levels in the last few months.
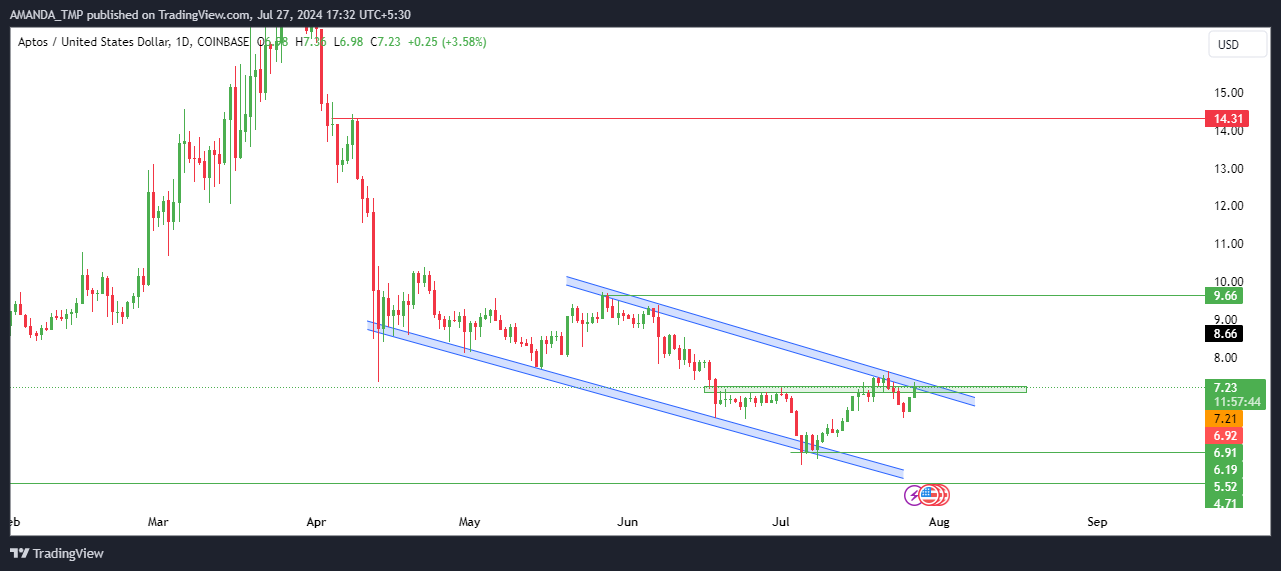
The APT token price’s overall technical structure was negative, and it followed a lower low swing price structure for a long time. From the swing highs of March 2024, the token’s price had declined by 70%.
The following token’s price behavior formed a falling wedge pattern on the daily chart, and the price traded inside the same.
A continuation on the higher side might be seen if the APT token price breaks further above the falling wedge pattern with strong momentum.
APT/USD Chart by TradingView.com
At press time, the APT token price struggled to break the 50-day EMA, and the 50-day and the 200-day EMAs traded in a death cross. Despite this, the Supertrend’s higher ATR was taken out, which resulted in bullish sentiment in price.
The MACD and the signal line further closed in the bullish trajectory, with its metrics trading in the golden cross from the last few weeks.
The RSI, too, broke out above the 14-day SMA and closed above the 50-zone on the daily chart. This exhibited a rise in the bullish momentum of the token.
Despite a 40% price increase from its recent swing low, the APT token’s liquidity remains low with a decline in traded volume.
Social media engagement has decreased, indicating reduced interest. Technical indicators suggested potential bullish momentum, but overall sentiment remained uncertain due to past volatility and negative trends.
The APT token’s price might take support at the levels of $4.70 and $5.50 in the future, followed by resistance levels of $9.60 and $14.30.
Disclaimer
This article is for informational purposes only and does not provide any financial, investment, or other advice. The author or any people mentioned in this article are not responsible for any financial loss that may occur from investing in or trading. Please do your research before making any financial decisions.




