
 Puffer
 ZKsync
 Bitcoin
 NEAR Protocol
 Pearl
Pearl Quantus
 Sui
Sui
- The Band Protocol token’s major holders bought it at higher levels from CMP.
- BAND token’s derivatives witnessed strong trading activity over the last 24 hours.
In the last 30 days, the Band Protocol token price has advanced by 40%. A bullish sentiment in the token followed this, and the fear and greed index was at 72.
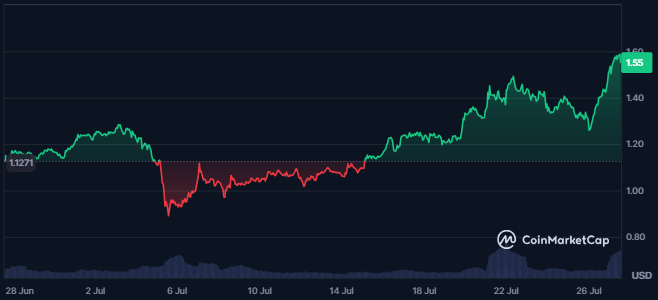
A huge surge in Band Protocol token demand was recorded as the spot volume advanced by 265% in just the last 24 hours. This further resulted in an advance of 380% in the token’s derivatives traded volume.
Following the surge in traded volume, the token’s market cap also advanced by 12%, and its market cap value was $228.413M. Band Protocol’s market cap ranking has been 222nd, as per CoinMarketCap, which followed a market cap dominance of 0.01%.
The following price metrics of the token showed lower popularity in the global crypto market. Also, the token’s high supply inflation resulted in 11.59%, followed by an infinite maximum supply.
Many positions were added to the Band Protocol token’s derivatives as its open interest advanced by 73% in 24 hours. Also, higher shorts worth $112.60K were liquidated.
Meanwhile, longs of only $54.07K in the token were liquidated. This showed buyers’ dominance in the price of the token.
Financial Data Analysis Of Band Protocol
Band Protocol Token had 35.3K holding addresses at press time, and the token’s top 10 holders held 84.18% of the total supply.
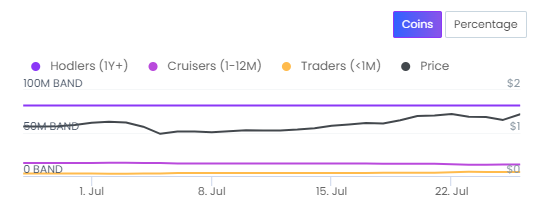
Only 12% of the token holders were in profit, while 77% witnessed a loss and bought the token at a higher price than the last traded price.
The holders look very confident about the future performance of the token, as 92% of holders have held the token for more than 1 year. Also, the token has a large holder concentration of 95%.
BAND Token Technical Analysis
A strong bullish candle has been formed on the token’s daily chart in the recent price action.
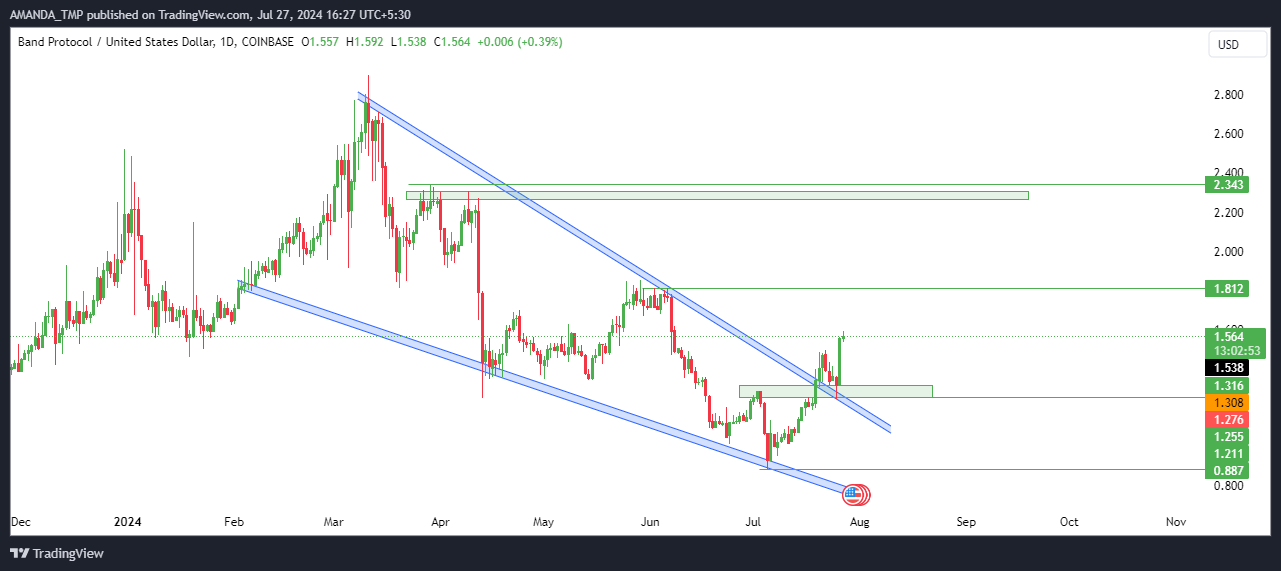
On 11th March 2024, a swing high of $2.9 was formed on the BAND token daily chart. Since then, the token trading price has started to witness profit booking. This led to a decline of 65% in the token trading price.
The following behavior of the token price formed a falling wedge pattern on the chart, and on 20th July 2024, it broke above the same pattern. The token price formed a strong bullish structure, followed by the breakout above the most recent swing high.
BAND/USD Chart by on TradingView.com
The supertrend higher ATR was taken out, leading to a bullish daily chart signal. Additionally, the 20-day and the 50-day EMAs formed a golden cross, and the BAND token price broke above both the EMAs.
The MACD and the signal line advanced to the bullish trajectory and traded in a bullish cross. The histograms formed on the chart were also green, which exhibited buying in the token.
Additionally, the RSI took support at the 14-day SMA and advanced to higher levels. It also traded above the 50-level and sustained above the same.
BAND token has shown a significant bullish trend, advancing 40% in the past month with a 265% increase in spot volume.
The token’s market cap rose by 12%, supported by strong technical indicators, including a bullish breakout and a golden cross. Investors remain confident, with 92% holding long-term.
The support levels for the BAND token are $0.880 and $1.30, followed by the resistances of $1.80 and $2.30.
Disclaimer
This article is for informational purposes only and does not provide any financial, investment, or other advice. The author or any people mentioned in this article are not responsible for any financial loss that may occur from investing in or trading. Please do your research before making any financial decisions.




