
 Zerebro
 Bitcoin
 Aerodrome Finance
 ZKsync
 Pearl
Pearl Pudgy Penguins
 Bitway
- AIOZ token is on the verge of breaking out above crucial levels.
- A strong surge in the trading activity of the AIOZ Network token was also recorded.
The AIOZ network token price was highly volatile at 9.8% at the time of writing. The market cap dominance of the token was 0.03%, which made it the 98th-ranked token in the global crypto market.
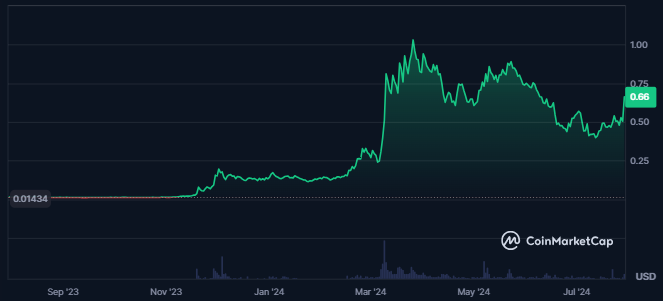
Price Overview Chart of AIOZ | Source: CoinMarketCap
The AIOZ Network token price has advanced by 4400% in the previous 1 year. The value of the traded volume for the token advanced by 460% in the last 24 hours.
The surge in the volume was followed by a rise of 31% in the token’s market cap in the last 24 hours. It showed how strong the demand for the token was at press time. Also, the market cap value of the token was $714.579M.
The token’s volume/market cap ratio was 2.01%, which showed low liquidity. The circulating supply and total supply of the token were 1.110B AIOZ. It resulted in a fully diluted market cap of $715.658M, close to the token’s spot market cap.
The AIOZ token’s sentiment was bullish, as per CoinCodex, and the Fear and Greed Index was at 74, showing greed among the investors.
AIOZ Network Token Derivatives Data Analysis
A surge of 32% in the open interest of the token was recorded in the last 24 hours. It resulted in an open interest value of $3.19M.
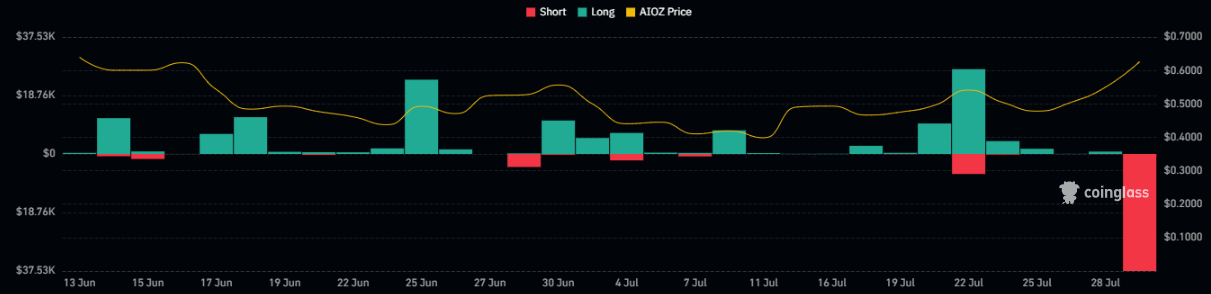
Following the surge in the open interest, a surge of 430% in the value of the derivatives trading volume was recorded.
The liquidation chart of the token further showed a huge surge in the short liquidation of the token. Also, the value of the shorts liquidated in the last 24 hours was 34.58K, against which the long liquidation was worth $784.19. It showed the dominance of buyers in the token’s price.
AIOZ Token Technical Analysis
The AIOZ token price has consistently advanced over the last few days. Following the most recent swing low, the price had advanced by more than 85%.
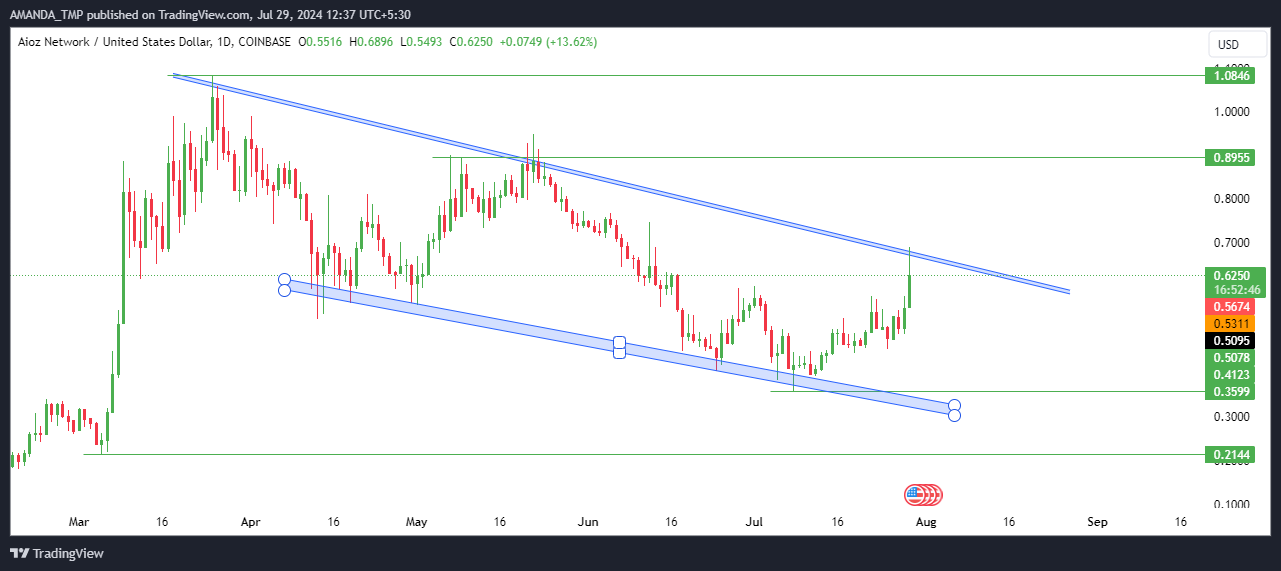
The AIOZ token’s price traded in a dynamic range followed by lower lows and a decline in the price over time. It resulted in the formation of a falling wedge pattern, and the token’s price traded inside the same at press time.
If the token price further breaks out above the wedge pattern in the future and closes above the same, a change in trend to bullish might be seen. That would lead the price to higher levels in the future.
AIOZ Token Technical Indicators Analysis
AIOZ/USD Chart by TradingView.com
The AIOZ token price broke out above the 50-day EMA at the time of writing. The 50-day and the 200-day EMAs further traded in a golden cross, which exhibited a bullish trend on the chart.
The MACD and the signal line traded in a golden cross and reached a bullish trajectory. If the metrics further sustain the bullish trajectory, a rise in the bullish momentum of the token might be seen.
The RSI also advanced above the 50 level and sustained above the 14-day SMA. It represented a rise in the bullish sentiment of the token price.
Will AIOZ Token Price Surge More?
AIOZ token is poised for a breakout above crucial levels, with a 9.8% increase in volatility. Trading volume surged 460%, and the market cap rose 31% in 24 hours, indicating strong demand. Technical indicators and bullish sentiment suggest a potential for further gains if the token sustains its momentum.
The AIOZ Network price might take support at the $0.210 and $0.350 levels and face resistance from the $0.8950 and $1.080 levels.
Disclaimer
This article is for informational purposes only and does not provide any financial, investment, or other advice. The author or any people mentioned in this article are not responsible for any financial loss that may occur from investing in or trading. Please do your research before making any financial decisions.




