
 astronaut
 Pearl
Pearl Zylo Ecosystem
 Bitcoin
 Bitway
 NEAR Protocol
 Zcash
Zcash
- The total value locked for the Beam token has declined over time.
- In the last 30 days, the BEAM token price traded in green for 20 days.
In the last 1 year, the token’s price has advanced by 264% and traded at a level of $0.01792 at press time.
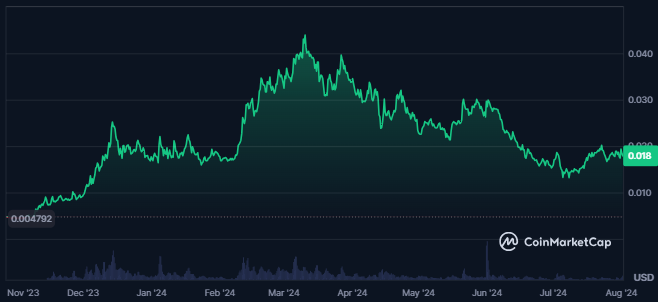
Price Overview Chart of BEAM | Source: CoinMarketCap
The BEAM token’s market cap witnessed a decline of 6.0% in the last 24 hours, valued at $881.909M. Also, the token’s market cap ranking was #73, as per CoinMarketCap.
The token’s traded volume value has also advanced 110% in the last 24 hours from press time. Also, the token’s volume/market cap ratio was 3.34%, followed by a traded value of $27.084M.
The Beam token price sentiment was bearish, as per the analysts, and the fear and greed index for the token was at 52. This showed the neutral sentiment of investors toward the token. Additionally, the market cap dominance of the token was 0.04%.
At press time, 22% of the token holders were in profit, while 60% were in loss. Also, the large holders’ concentration for the crypto was 86%, and none have held the token for more than 1 year.
Beam Token Derivatives Data Analysis
The token’s derivatives traded volume value has advanced by 165% in the last 24 hours.
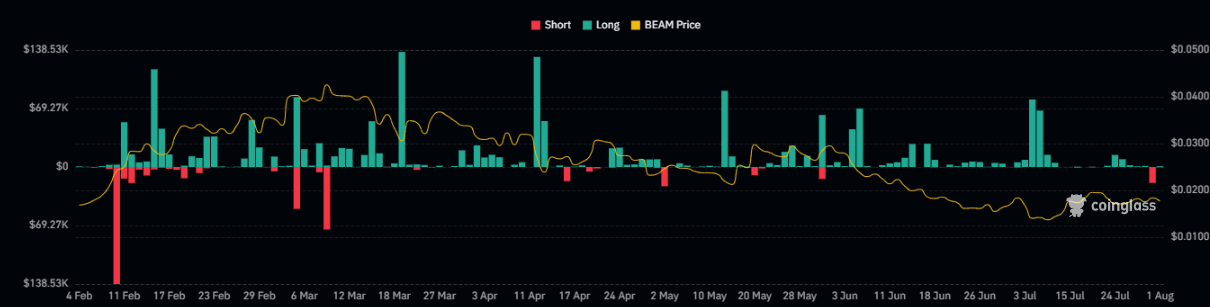
A surge of 3.2% in the Beam token’s open interest was also recorded, resulting in $7.68M. This indicated a surge in the open positions of the token’s derivatives.
However, over time, higher long liquidations were recorded in the token. It witnessed a huge short liquidation of $19.36K in the last 24 hours against the longs of $917.0. This showed a dominance of buyers in the price over the last 24 hours.
BEAM Token Technical Analysis
The BEAM crypto price chart revealed a pronounced downtrend, with the asset’s value steadily declining over the past few months. This continuous descent to lower levels was highlighted by the formation of consistent lower lows on the daily chart. It indicated a robust bearish structure.
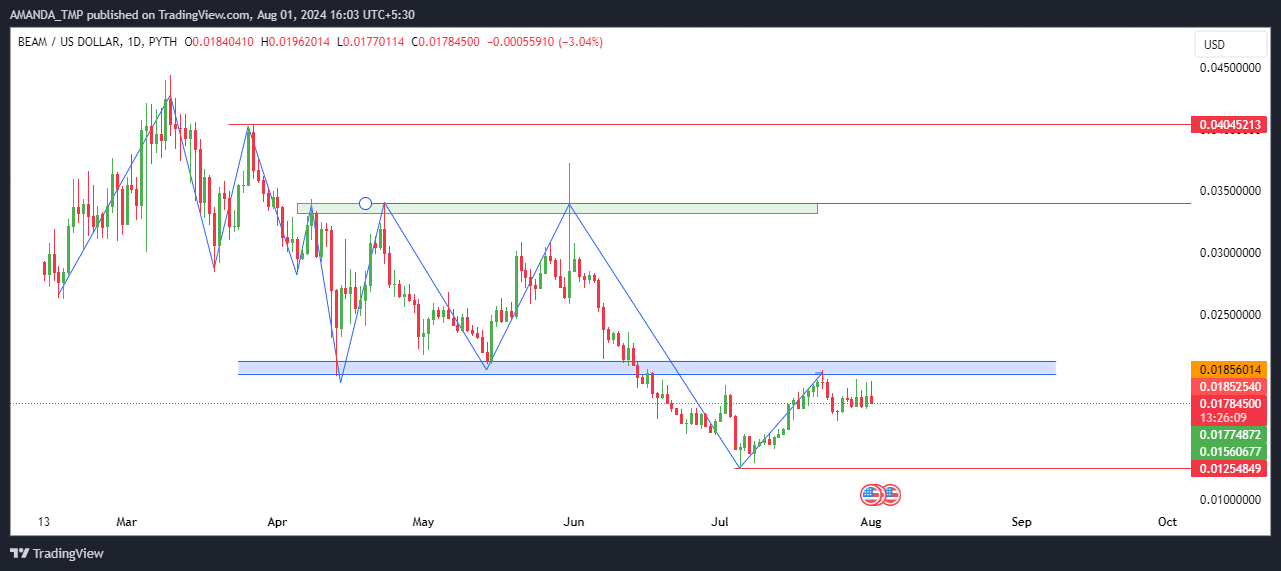
BEAM Token Daily Price Chart | Source: TradingView
In the event of a price rebound, BEAM is likely to encounter resistance at higher levels. This resistance could precipitate a liquidity grab, ultimately driving the price back towards its previous swing lows.
Recent price actions reinforce the bearish outlook. The cryptocurrency has recently fallen below a significant support level, and this breakdown suggested an increased likelihood of continued downward momentum. The prevailing sentiment and technical indicators pointed to continuing the bearish trend in the near term.
BEAM Token Technical Indicator Analysis
The technical indicators for BEAM cryptocurrency show uncertainty in its price trend. The 20-day and 50-day Exponential Moving Averages (EMAs) exhibited a death crossover, signaling potential bearish momentum at press time.
BEAM/USD Chart by TradingView.com
The Moving Average Convergence Divergence (MACD) and the signal line both traded neutrally, having overlapped each other.
The Relative Strength Index (RSI) has also demonstrated a bearish cycle. It was taking support at the 50-level but declined below the 14-day SMA.
The BEAM token has shown a significant downtrend with a recent market cap and trading volume decline.
Despite some short-term gains, technical indicators like EMAs and RSI suggest bearish momentum. However, a recent surge in derivatives trading volume and a high concentration of large holders hint at potential volatility.
The Beam token price might take support at the levels of $0.1250 and 0.150, followed by the resistances of $0.0330 and $0.040.
Disclaimer
This article is for informational purposes only and does not provide any financial, investment, or other advice. The author or any people mentioned in this article are not responsible for any financial loss that may occur from investing in or trading. Please do your research before making any financial decisions.




