
 astronaut
 Walrus
 Pearl
Pearl Bitcoin
 NEAR Protocol
 Zcash
Zcash Hyperliquid
- Toncoin token price outperformed 89% of the top 100 crypto assets in the last 1 year.
- TON token had a huge liquidity based on its market cap.
The Toncoin token price was 1480% above its all-time low price of $0.3906, achieved just two months ago.
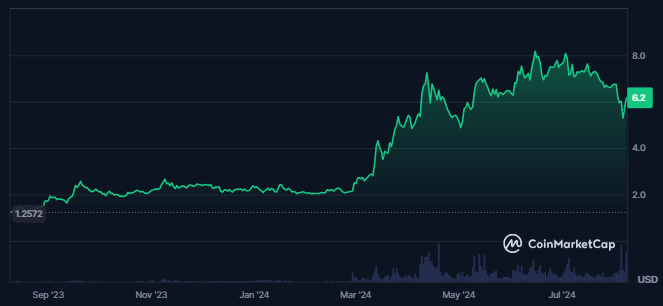
The market cap and the traded volume value of TON have advanced together, showing a surge in the demand for the token. Following this, the token’s market cap had advanced by 8.4% in the last 24 hours.
The token’s market cap value was $15.552 Billion, and the traded volume value was $926.745 Million. This resulted in a volume/market cap ratio of 5.87%, which showed good liquidity in the token price.
The fear and greed index was 20, showing fear among the investors. On the other hand, the token’s sentiment was neutral, as per the analysts.
Also, the market cap dominance of the token was 1.06%. This represented its strong market presence as Toncoin was the 8th largest cryptocurrency in the global crypto market.
The token’s total value locked was $584.89 Million, which has consistently risen over time. Also, the stablecoins market cap of the token was $619.67 Million, which represented the strength of the token project.
Toncoin Token Derivatives Data Analysis
The traded volume of the Toncoin witnessed a huge surge of 330% in just the last 24 hours from the press time. This showed a huge advance in the trading activity of the token, followed by a surge in traders’ interest.
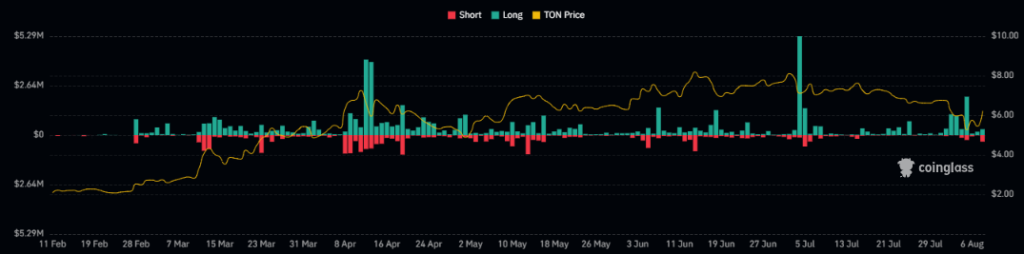
The token’s open interest further rose by 24.9% in the last 24 hours. This showed a surge in the token derivatives’ open positions.
Higher long liquidations in the token were recorded against which the amount of shorts liquidated was much less. This represented the strong dominance of bears in the Toncoin token price.
TON Token Technical Analysis
The TON token price has traded in a large, volatile range for a long time. It declined by 40% from the swing high of $8.14 in a month. The following declining behavior of the price led to the formation of a dynamic trendline.
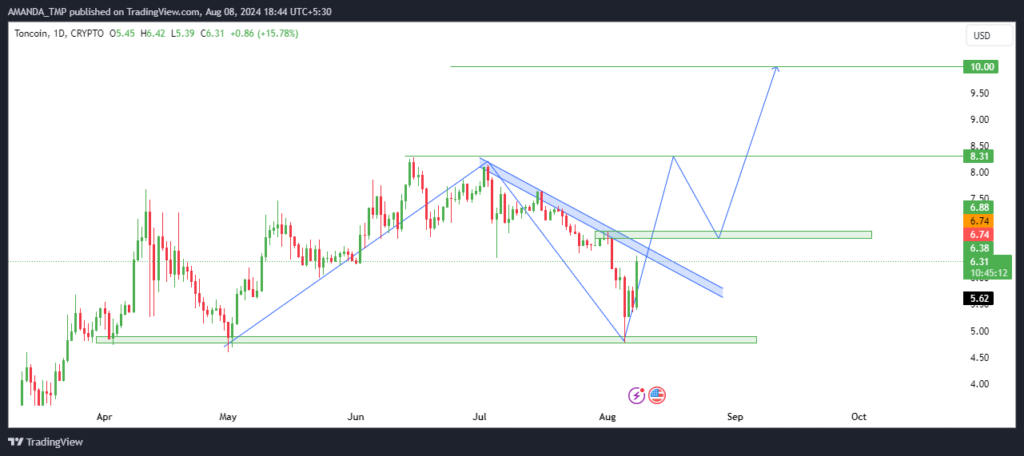
A strong green candle was formed as per the recent price action. If the token’s price continues to advance further, it might break out above the dynamic trendline. TON token might hit the mark of $10.0 in the near future.
TON Token Technical Indicator Overview
The 50-day and 200-day EMAs have traded in a golden cross while the price declined below the 50-day EMA. If the token price rebounds above the 50-day EMA, we might see a strong bullish momentum in price.
TON/USD Chart by TradingView
The MACD and the signal line traded in a death cross, and the metrics also traded in a negative trajectory. This was followed by bearish histograms on the chart, which exhibited a bearish sentiment about the price.
The RSI declined to the oversold zone and rebounded from the lower level. It broke out above the 14-day SMA but could not break above the 50-level. This exhibited weakness in the token price.
The support levels for the TON token are $3.30 and $5.0, followed by the resistance levels of $8.30 and 10.0.
Disclaimer
This article is for informational purposes only and does not provide any financial, investment, or other advice. The author or any people mentioned in this article are not responsible for any financial loss that may occur from investing in or trading. Please do your research before making any financial decisions.




