
 astronaut
 Pearl
Pearl Zcash
Zcash Walrus
 NEAR Protocol
 Starknet
 Pudgy Penguins
- Golden crossover has been generated in the HNT token’s key moving averages.
- The Helium crypto price has jumped by 96% in the past 5 days, which showed complete domination.
As we can see on the chart, the HNT price has declined by forming lower lows and lower highs since March. However, the sellers have failed to dominate in the lower-high territory. The price has advanced the key moving average.
The bearish trend in Helium crypto was halted near the $3 hurdle and has shown strength. The price has triggered a pullback while supporting the 200-day EMA. It witnessed a massive upmove of 35% in just 2 days.
According to the technical indicators, the RSI developed a bullish crossover with the RSI-based moving average. It rose to the overbought zone. The price exceeded the key moving averages, showcasing the bullish forecast.
HNT Price Overview
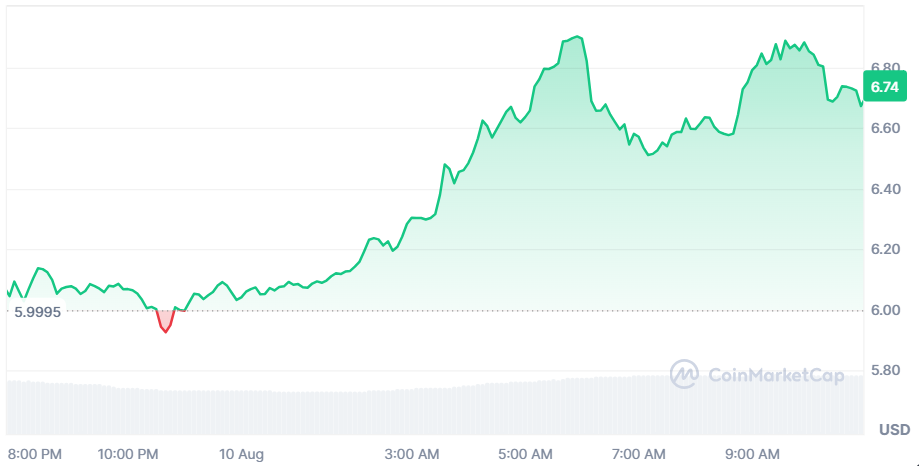
The Helium crypto traded at $6.74 at press time, surging by 1.19% in the past 24 hours. The market capitalization was $1.08 Billion, and the 24-hour trading volume was $29.22 Million at the time of writing.
Is a Massive Upsurge Loading in Helium Crypto?
Based on a source on X, the HNT price has triggered a bullish breakout and is ready to perform extraordinarily. During a weekly time frame, the price has shaped a falling wedge pattern and triggered a strong breakout.
$HNT (Helium) has displayed a bullish breakout of the secondary setup and a massive upside looks to be in-effect!
— JAVON⚡️MARKS (@JavonTM1) August 9, 2024
Prices, with a larger breakout holding, can be in pursuit of the $52.76 target and an additional +651% increase could be on the way! https://t.co/5iKwRTpC0a pic.twitter.com/P6zesU44nS
After the successful breakout, the HNT price is expected to reach the $52.76 mark as its target. An additional gain of 651% could be seen if the bulls remain strong.
HNT Price Looks Incredible
A source on X claimed that the Helium crypto looks incredible from every perspective. According to the chart structure, the buying signal has been generated. It has triggered a breakout from the cup and handle candlestick pattern.
from every perspective, $HNT looks incredible
— mr mcduck (@ruedesilver) August 8, 2024
chart is screaming "buy me plz" with a textbook cup/handle break out today
migrated to solana last summer, so catches the solana beta bid in addition to the DePIN bid
s/o @collie_crypto for bullposting this earlier
am excite pic.twitter.com/PRIWjvh4rJ
On a wider time frame, the Helium price has found its bottom and has shown bullishness. Exceeding the last swing high of the $10 hurdle might bring confidence to the buyers. They can lead the trend for the long term.
Are Buyers Eyeing for a Massive Gain in HNT Crypto?
The key moving averages could play a vital role in the Helium price’s further momentum. Suppose the digital asset price manages to sustain over the key moving averages. The buyers may hold the grip and lift the price further.
On the other hand, buyers might panic if the HNT price slips below the key moving averages. The price below this zone would be a bearish sign, and it may melt to the major support level of $3.
Would the HNT Price Keep Surging, or Is it a Trap?
Based on the chart structure, the HNT price has reached the bottom and has gained bullish momentum. The price has recovered from the major support level of $3 and has surpassed the key moving averages.
The price over the 200-day EMA is bullish, and the sellers might show interest below the key moving averages. After seeing the recent bullish momentum, the momentum has been shifted to the buyers. It can result in a trend reversal.
Technical Levels
Helium’s price is expected to face resistance from the $8.00 and $10.00 levels. The price may take support at the $4.00 and $3.00 mark.
Disclaimer
This article is for informational purposes only and provides no financial, investment, or other advice. The author or any people mentioned in this article are not responsible for any financial loss that may occur from investing in or trading. Please do your research before making any financial decisions.




