
 Dacity Coin
 Injective
 Starknet
 NEAR Protocol
 Pearl
Pearl Quantus
 Pump.fun
- The ORDI price was at the crucial level of breakout at press time.
- ORDI crypto’s price has reached the 20-day EMA and is eyeing for the 200-day EMA.
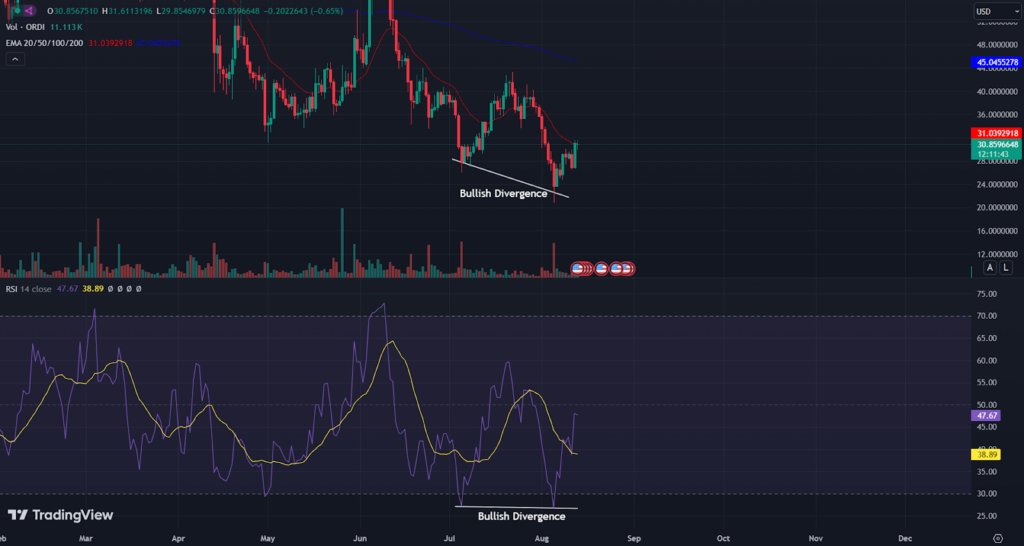
The ORDI price has risen by forming higher highs and higher lows since November 2023. However, the trend was flipped to bearish in March and reacted negatively ahead. Since March, it has declined due to resistance from a descending trendline.
Historically, the ORDI price had shown strong buying momentum after the consolidation from the $20 zone. After the bearish momentum, the price dropped to the $20 zone and showed bullishness.
Based on the technical chart, it seems that the ORDI price has reached the bottom and is ready to shoot up. That’s because the RSI has displayed positive signs and has experienced a bullish forecast.
RSI Analysis
The Relative Strength Index (RSI) has generated a bullish divergence, a bullish sign.
It has triggered a bullish crossover with the RSI-based moving average, which showcased the bullish forecast. Most of the technical indicators are in favor of a bullish forecast.
ORDI Price Overview
At press time, the ORDI crypto traded at $30.87, which has remained neutral for the past 24 hours. It has a market capitalization of $647.49 Million, and the 24-hour trading volume was $171.79 Million.
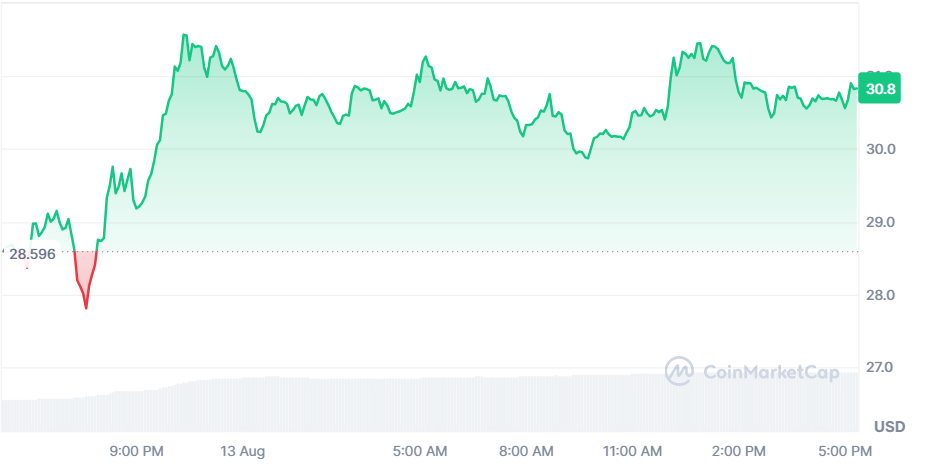
The circulating and the total supply of ORDI are 21,000,000, and the fully diluted market cap was $645.64 Million at the time of writing. The ORDI crypto has diluted 100% of its total supply of coins in the open market.
The trading volume at the reversal zone has increased by 83% in the past 24 hours. It might be a bullish sign, and it may boost the price.
Is the ORDI Price Ready to Trigger a Breakout?
Based on a source on X, the ORDI crypto price is at a crucial breakout level. The price has formed a pennant pattern and reached the breakout level.
$ordi set alerts pic.twitter.com/vAf3oSTaKF
— Blockchainmaneofficial (@blockchain_mane) August 12, 2024
Suppose the price triggers a breakout from the pennant; buying momentum can be anticipated.
ORDI Price Has Shaped a Falling Wedge; What’s Next?
The ORDI price formed a complete ‘Falling Wedge’ pattern during a daily time frame and reached the crucial breakout level. The price has taken support on the lower trendline and has reacted positively.
Suppose the price triggers a breakout from the wedge and exceeds the 200-day EMA; buying momentum can be seen. If the trading volume increases at the breakout time, it might boost the bullish momentum for longer.
Alternatively, buyers might panic if the price starts trading below the $20 mark. Sellers below the $20 level may dominate for longer, and it might be tough for the buyers to bounce back.
ORDI Price Forecast
The ORDI price has undergone significant fluctuations but is showing signs of potential bullish momentum.
The technical indicators, like the Golden Crossover in RSI and a Falling Wedge pattern, suggest a possible upward movement in the price.
If the ORDI price triggers a breakout and sustains momentum, it could indicate a favorable buying opportunity. Conversely, a failure to maintain bullish momentum might lead to further decline, particularly if the price drops below the $20 mark.
Technical Levels
The ORDI price is expected to face resistance from the $40 and $50 levels. The price may take support at the $26 and $20 mark.
Disclaimer
This article is for informational purposes only and provides no financial, investment, or other advice. The author or any people mentioned in this article are not responsible for any financial loss that may occur from investing in or trading. Please do your research before making any financial decisions.




