
 Dacity Coin
 Injective
 Celestia
 Quantus
 Pearl
Pearl Pudgy Penguins
 Bittensor
- The MKR token price traded in green for 13 days in the last 30 days.
- The Maker token price had outperformed 65% of the top 100 crypto assets in the last 1 year.
The total value locked for the Maker crypto was $7.068B, while the token’s liquidity was $190.51M at press time. Moreover, the total raised amount for crypto was $54.5M, and the annualized fee was $224.95M.
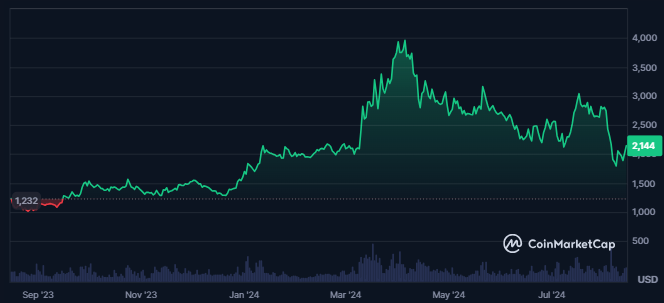
The token’s market cap has further advanced by 7.7% in the last 24 hours, and its market cap ranking was #39, as per CoinMarketCap. The token’s trading volume has further witnessed an advance of 63%.
The volume/market cap ratio of the MKR token was 5.72%. The token’s total supply was 977.631M MKR. This was followed by a circulating supply of 930.3K MKR, 92.5% of the maximum supply.
The token’s maximum supply was 1.005B MKR, resulting in a fully diluted market cap of $2.155B. This was followed by a spot market cap of $1.996B, which resulted in a market cap dominance of 0.09%.
MKR token price was highly volatile, resulting in a volatility of 15.27%, which might lead to uncertain spikes in the token price. The token price’s sentiment was further neutral, and the fear and greed index was at 30, showing fear among token investors.
Maker Token Derivatives Analysis
The open interest in the token has advanced by 20.2% in the last 24 hours. This was followed by an increase of 150% in derivative volume. The current open interest for the token was worth $123.49M.

The short liquidation recorded for the token was much less than the short liquidation for the token. Moreover, the token’s long liquidation was worth $39.75K, and the short liquidation for the token was $68.48K.
The following derivatives data indicated bulls’ dominance in token price, followed by the surge in the spot and derivatives volume.
MKR Token Technical Analysis
A clear, attractive price structure has been formed on the daily chart of the MKR token. Let’s take a look at what should be an investor’s plan of action:
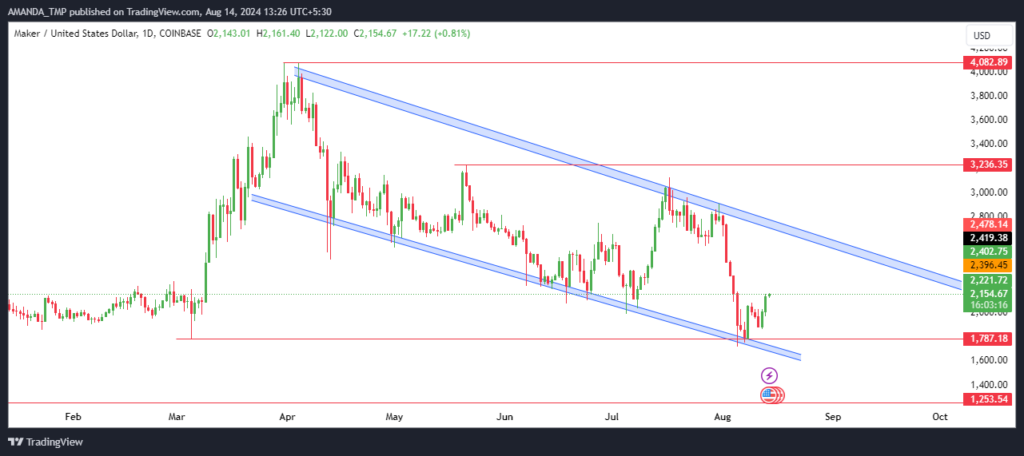
The MKR token price consistently declined over the last few weeks, followed by a lower low swing on the chart.
Additionally, the following behavior of the Maker token led to the formation of a falling wedge pattern. Following the most recent price action on the chart, the token hit the lower band of the wedge pattern and received support.
If further had formed strong bullish candles followed by the formation of higher high swing in the smaller timeframe.
Conversely, if the MKR token price continues to surge and break above the wedge pattern, we might shift the price trend to bullish.
Maker Token Technical Indicator Analysis
The MKR token price traded in a strong downtrend for a long time, leading to the technical indicators forming bearish setups. Additionally, most technical indicators still give a bearish signal on the chart.
MKR/USD Chart by TradingView
The MACD and the signal line formed a death cross and traded in the negative trajectory. The RSI also traded below the 50 level and followed a bearish cycle.
Despite this, it broke out above the 14-day SMA. If it breaks further above the 50 level, the token price might be strengthened.
The support levels for the MKR token are $1250 and $1780, followed by resistance levels of $3230 and $4080.
Disclaimer
This article is for informational purposes only and does not provide any financial, investment, or other advice. The author or any people mentioned in this article are not responsible for any financial loss that may occur from investing in or trading. Please do your research before making any financial decisions.




