
 streamoors
 IGNITION
 Injective
 NEAR Protocol
 Pearl
Pearl LayerZero
 Hyperliquid
- The fear and greed index of the GMX token was at 30, which showed fear among investors.
- Higher short liquidation was recorded in the GMX token in the last 24 hours.
GMX token supply inflation is 6.61%, with a circulating supply of 9.624 Million GMX. Additionally, the token’s maximum supply was infinite. This further was followed by a fully diluted market cap of $278.032 Million.
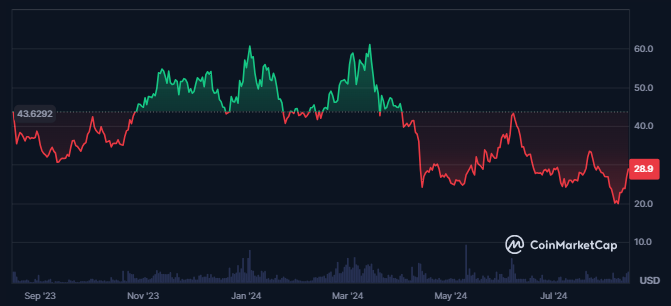
There has been a surge of 102% in the trading volume of the GMX token, recorded in the last 24 hours. This showed a rise in crypto’s trading activity. The token’s traded volume value in the previous 24 hours was $43.924 Million.
The token’s market cap has also witnessed a surge of 13% in just the last 24 hours. This resulted in a huge liquidity of 15.4%.
Additionally, the market cap ranking of the GMX token was 159 with a market cap value of $278.087 Million. If further has a low market cap dominance resulting in 0.01%.
Following the surge in the spot volume, the derivatives volume of the token advanced by 214%. Also, there was a surge of 41% in the token’s open interest. It showed an advance in the open positions of the derivatives.
GMX Token Blockchain Data Overview
The TVL for the GMX token has been flat over time, suggesting that investors are confident about the project.
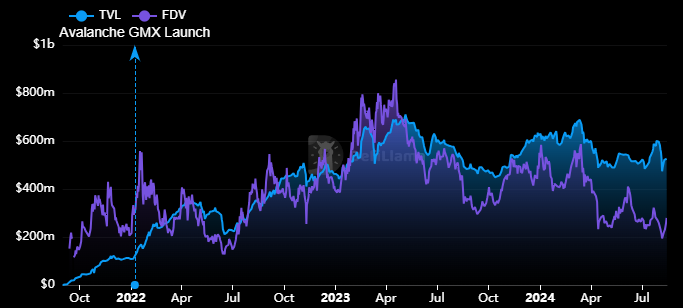
At press time, the token’s liquidity was worth $12.82, and its annualized revenue was worth $12.35 Million. Additionally, 60.53% of the GMX token’s market cap was staked, amounting to $171.02 Million.
There was a surge of 8.3% in the token’s net deposits in the last 30 days. This was followed by a surge of 99% in the token’s incentives.
Despite this, only 3% of the token holders were profiting. Also, 86% of the token’s holders have held it for over a year. This could be one of the reasons for the sustainability of the token’s TVL.
GMX Token Technical Analysis
A falling wedge pattern, which looks more like a descending triangle pattern, formed on the GMX token’s daily chart.
GMX/USD Chart by TradingView
On March 13th, 2024, a swing high of $62.84 was formed, and the token price declined. The following price behavior led to a more than 70% decline.
Also, the following price behavior led to a falling wedge pattern, which advanced to the upper band after hitting the lower band.
If the token further breaks above the following pattern and sustains above the same, we might see an uptrend. The technical indicators on the daily chart of GMX token further indicated uncertainty and mixed sentiments.
The GMX token price might take support at the levels of $12.0 and $17.00, followed by the resistance levels of $44.00 and $62.00.
Disclaimer
This article is for informational purposes only and does not provide any financial, investment, or other advice. The author or any people mentioned in this article are not responsible for any financial loss that may occur from investing in or trading. Please do your research before making any financial decisions.




