
 Pearl
Pearl Bitway
 Pudgy Penguins
 Optimism
 Walrus
 NEAR Protocol
 Pons
Pons
- The LTC price has recovered 32% from the recent low and has advanced to the 20-day EMA.
- The RSI has displayed and triggered a bullish divergence.
The technical chart demonstrates that the LTC price has been defending the major support level of $60 for a year. However, it dipped below the $60 mark, and the buyers were stronger. It showed strong price rejection, and the breakdown turned out to be fake.
When writing, the major support zone worked as a demand zone, and the Litecoin price departed from the demand zone. It surpassed the 20-day EMA and headed toward the 200-day EMA.
The buyers have lost momentum since the beginning of April, and the bullish trend has halted. The LTC price kept declining by forming lower lows and lower highs.
It recently emerged from the lower low zone and was eyeing for the lower high.
Litecoin Price Overview
When writing, the Litecoin price traded at $65.70 with an intraday gain of 0.53%. It had a market capitalization of $4.95 Billion and ranked 19th in the cryptocurrency market.
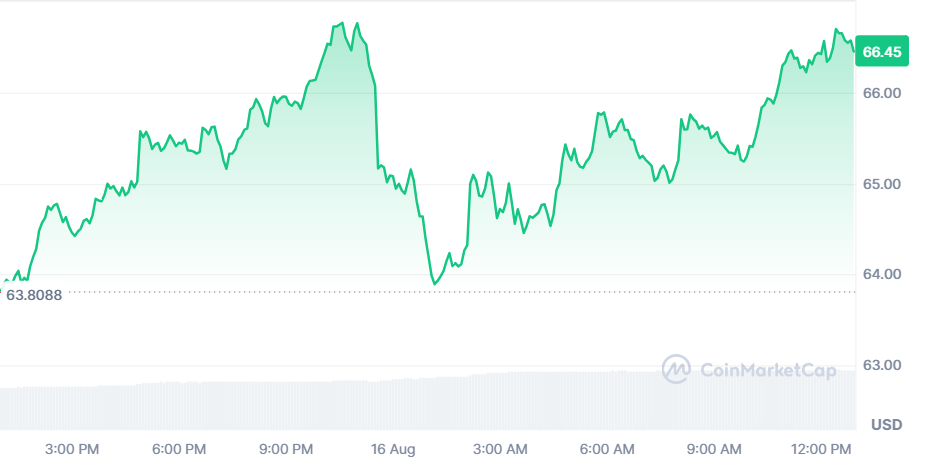
The 24-hour trading volume was $404.10 Million at the time of writing, which increased by 42%. Its circulating supply was 74,867,437 LTC, and the total supply was 84,000,000 LTC.
Is a Massive Move Awaited After Breakout?
A source on X claimed that the Litecoin price is expected to have a giant upsurge after the breakout. The price has been forming a symmetrical triangle in a weekly time frame.
$LTC weekly breakout will be crazy pic.twitter.com/hR2dR31O5w
— Kaizen (@Ka1zen_X) August 15, 2024
Massive buying momentum can be anticipated if the price triggers a breakout from the triangle pattern.
Could LTC Price Reach $100 After Breakout?
A source on X suggested that the Litecoin price may approach the $100 hurdle after the breakout. The price has been falling through a trendline and has reached the crucial breakout level.
$LTC (Update)
— ZAYK Charts (@ZAYKCharts) August 16, 2024
Descending Channel Formation in 1D Timeframe✅
When a breakout happens, Next Target will be 100$ #LTCUSDT #LTC #Litecoin #Crypto pic.twitter.com/OFq95dJfPs
Technical Analysis of the LTC Price Over a 1-D Timeframe
In a daily time frame, the Litecoin crypto price has been on a bearish trend and falling through a trendline. After taking support on the lower trendline, the price has extended to the upper trendline.
The digital asset price reached the crucial breakout level, and the trading volume also increased. Buying momentum can be seen if the price triggers a breakout from the channel. Exceeding the 200-day EMA would invite buyers for the $100 hurdle.
On the other hand, if the crypto asset price faces resistance from the upper trendline, sellers may drag down the price to the lower trendline. Suppose the LTC price triggers a breakdown from the channel; sellers may dominate further.
Turning to the technical indicators, the RSI has shown bullish divergence and golden crossover, which indicates a bullish forecast. MACD has displayed a bullish crossover with the Signal line, and the histograms have flipped to red.
Litecoin Price Analysis
The LTC price chart showed signs of strength and potential for a bullish breakout. The price action has indicated resilience around the $60 support level. Also, there were bullish indicators, such as the bullish divergence in RSI and MACD.
There has been speculation in the market regarding a potential upsurge. The LTC price reaching the $100 mark after a breakout might still be possible.
Considering the overall market conditions and the current technical outlook, both bullish and bearish scenarios should be carefully considered.
Disclaimer
This article is for informational purposes only and provides no financial, investment, or other advice. The author or any people mentioned in this article are not responsible for any financial loss that may occur from investing in or trading. Please do your research before making any financial decisions.




