
 Walrus
 Quantus
 Pudgy Penguins
 Bitway
 Quant
Quant Sui
Sui Bitcoin
- The ATOM token price declined by 43% in the last one year.
- Cosmos has medium liquidity based on its current market cap.
When writing, the Cosmos token market cap had declined by 4.1% over the last 24 hours. After that, its volume advanced by 24%. It showed a rise in bears’ dominance in the token price.
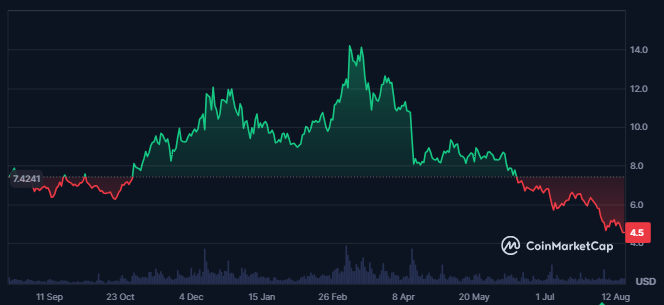
The Cosmos token price advanced 300% from its all-time low (ATL) price of $1.13, which was marked four years ago. Its all-time high (ATH) price was achieved three years ago. At press time, the price was down by 89% from ATH.
The Cosmos price volatility was high at 11.64%, and its market cap presence was also outstanding. Its market cap dominance was 0.09%, and the price sentiment was bearish.
The supply inflation of the Cosmos token was further high at 12.79%, and its circulating supply was 390.93M ATOM. Its total supply was the same, while the maximum supply was infinite.
A surge in the ATOM token’s social dominance was also recorded as the number of Reddit subscribers increased to 92.04K. Its X (Twitter) account boasts 558.25K followers at press time.
Cosmos Token Derivatives Data Analysis
A surge in the derivatives trading activity of the Cosmos token was recorded over the last 24 hours. This was followed by a surge of 23% in its derivatives traded volume.
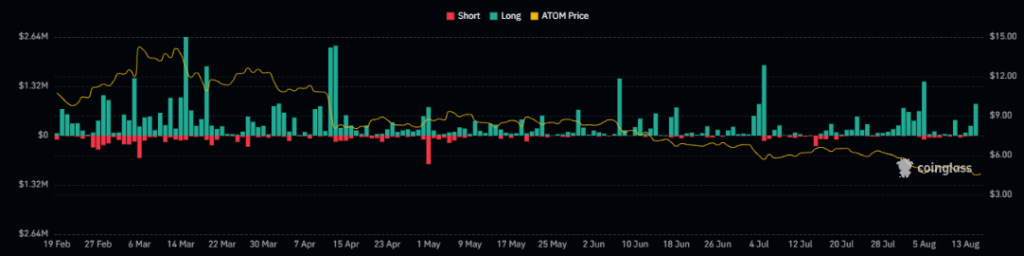
The derivatives liquidation chart of Cosmos token showed an advance in the long liquidations over the last few weeks. That exhibited a strong profit booking in longs in the token, which led the price to certain lows.
The open interest in the Cosmos further led flat over the last 24 hours, followed by a slight decline of 0.45%. This resulted in an open interest value of $70.39M, and a long liquidation of $828.42K was recorded.
ATOM Token Technical Analysis
The ATOM token has experienced a sustained downtrend, driven largely by the development of a falling wedge pattern on the daily chart.
This bearish trend began in March 2024, after the token reached a swing high of $14.5. Since that peak, the token has been in a continuous decline.
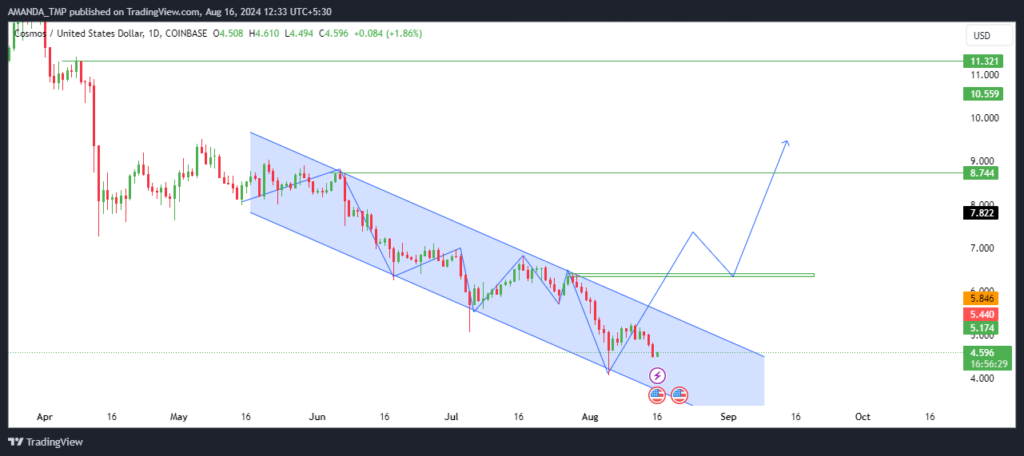
This downward movement was marked by the formation of lower lows, further reinforcing the falling wedge pattern. The price has consistently traded within this pattern for the past three months, highlighting the ongoing bearish sentiment.
However, suppose the Cosmos (ATOM) token breaks out of the falling wedge with strong momentum and manages to sustain this breakout. It could signal a potential reversal in the price trend.
Such a breakout would be a critical indicator of a shift from the prolonged bearish phase to a more bullish outlook.
ATOM Token Technical Indicator Analysis
The ATOM token has been under significant selling pressure, as evidenced by several key technical indicators on the daily chart.
The 50-day and 200-day EMAs have been locked in a death cross for over three months. This was accompanied by the token price consistently trading below these levels.
ATOM/USD Chart by TradingView
In addition to the bearish EMA signals, the Supertrend indicator on the daily chart has issued a strong sell signal. The token price has remained below the Average True Range (ATR) level, reinforcing the negative market sentiment.
The Moving Average Convergence Divergence (MACD) indicator supported this bearish outlook. MACD and signal lines have maintained a death crossover, continuing to sustain a negative trajectory that signals ongoing selling pressure.
Moreover, the Relative Strength Index (RSI) has declined into the oversold zone, overlapping with the 14-day Simple Moving Average (SMA). This convergence in the oversold territory underscored the strong bearish sentiment surrounding the ATOM token.
Support levels for the token were positioned at $4.00 and $4.50, while resistance levels were identified at $8.70 and $11.30. These levels will be critical in determining the token’s near-term price action.
Disclaimer
This article is for informational purposes only and does not provide any financial, investment, or other advice. The author or any people mentioned in this article are not responsible for any financial loss that may occur from investing in or trading. Please do your research before making any financial decisions.




