
 Zerebro
 Bitcoin
 Aerodrome Finance
 ZKsync
 Pearl
Pearl Pudgy Penguins
 Bitway
- A decline was recorded in the SUI token’s open interest over the last 24 hours.
- The SUI token supply has not decreased, which means it cannot be burned.
The token’s circulating supply was 25.96% of the maximum supply, resulting in 2.596B SUI. It got the maximum supply of 10.0B SUI and a fully diluted market cap of $8.224B.
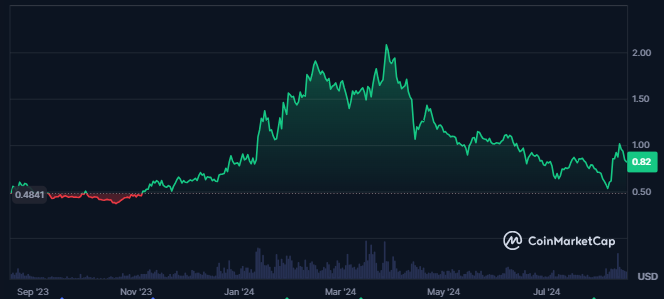
When writing, the SUI token’s spot volume witnessed a decline of 22.9% in the last 24 hours. It resulted in a traded value of $233.724M, and the market cap also declined by 6.8%. That showed a decline in the token’s demand.
The token’s market cap was $2.130B, making it the 34th largest cryptocurrency in the global crypto market. Its market cap dominance was 0.09%.
Over the last few days, the token’s Total Value Locked (TVL) advanced to $588.28M. This was followed by a stablecoins market cap of $369.03M.
The token had 20.585M holding addresses, and the top 10 holders held 13.55% of the total supply. Also, a consistent rise in the number of holding addresses for the token was recorded.
The holders’ data showed a strong surge in the investors’ confidence. Besides, the token’s largest holder alone held 5.36% of the total supply, resulting in 535.714M SUI.
SUI Token Derivatives Data Analysis
The token’s derivatives positions declined as its open interest declined by 5.8% over the last 24 hours.
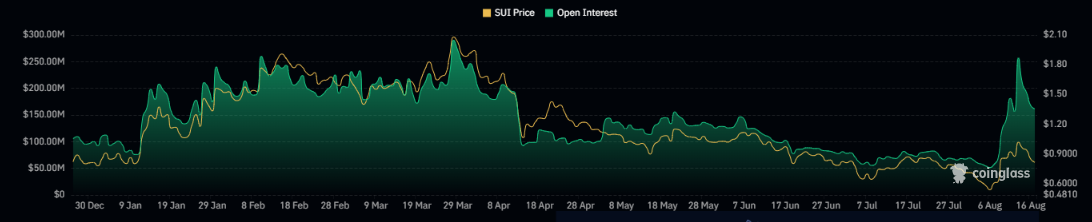
Additionally, longs worth $1.36M were liquidated in the last 24 hours against shorts worth $727.39K. That further showed the dominance of sellers over the price.
Also, a decline of 22.5% in the token’s derivatives volume was recorded, which resulted in a traded value of $932.25M.
SUI Token Technical Analysis
Since the end of March 2024, SUI has been caught in a significant downtrend characterized by steady profit booking. The token’s price has declined sharply from a swing high of $2.1816 to its current traded price of $0.6898.
This decline reflected a broader bearish sentiment, evident in the formation of lower lows on the daily chart.
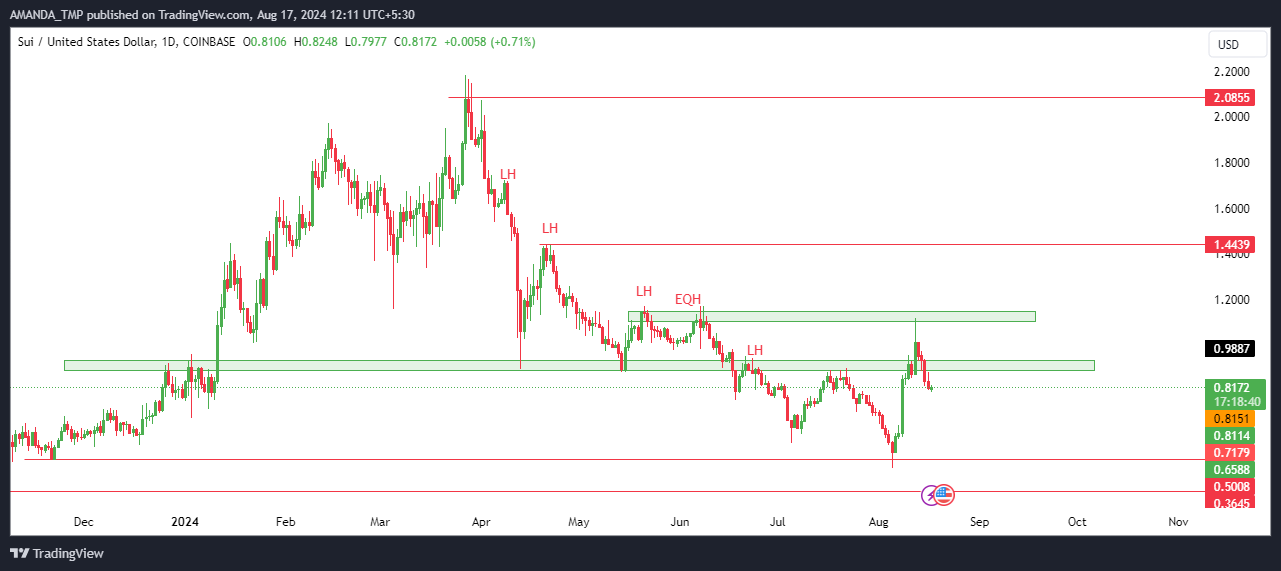
Recently, SUI formed a narrow trading range following its pronounced downtrend. Although the token managed to reverse from lower levels, it struggled to maintain its momentum and failed to sustain higher prices. This indicated ongoing uncertainty and pressure from sellers.
Despite this bearish backdrop, there is a possibility of a reversal. If SUI can break above the $0.950 level and sustain its position, it could spark a minor rally, providing a much-needed boost to the token’s price action.
However, the market remains cautious, and SUI needed to overcome key resistance levels to signal a more substantial recovery.
SUI Token Technical Indicator Analysis
The SUI price action has exhibited significant weakness, as the token has declined below both the 50-day and 200-day EMAs on the daily chart.
This downward movement underscored a strong bearish trend. It was further emphasized by the EMAs forming a death cross—an indicator of sustained selling pressure.
SUI/USD Chart by TradingView.com
In addition to the moving averages, the Supertrend indicator has signaled “sell” for an extended period, aligning with the ongoing price decline.
MACD and signal line have also entered a death cross, reinforcing the bearish outlook as they continue to trade in negative territory.
The Relative Strength Index (RSI) added to this negative sentiment, following a bearish cycle and dropping below the critical 50-level. The RSI’s movement into oversold zones suggested that the selling momentum remains strong. It further confirmed the prevailing downward trend in the SUI price.
The SUI token price might take support at the $0.360 and $0.50 levels, and it may face resistance at the $1.50 and $2.080 levels.
Disclaimer
This article is for informational purposes only and does not provide any financial, investment, or other advice. The author or any people mentioned in this article are not responsible for any financial loss that may occur from investing in or trading. Please do your research before making any financial decisions.




