
 Pearl
Pearl Zylo Ecosystem
 Sui
Sui Starknet
 Pons
Pons NEAR Protocol
 Quantus
- DYDX token price was highly volatile, resulting in a volatility of 13.53%.
- The token’s price sentiment was neutral, as per the analysts.
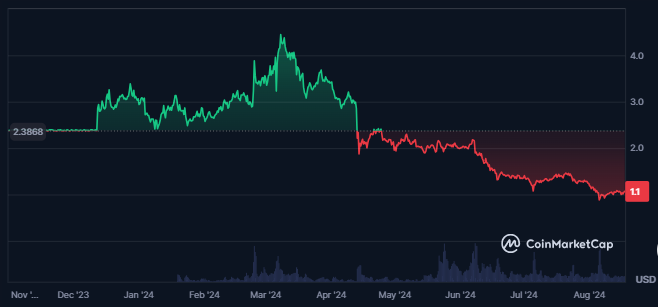
In the last 1 year, the DYDX token price witnessed a decline of 55% and followed a strong downtrend.In the last 1 year, the DYDX token price witnessed a decline of 55% and followed a strong downtrend.
The token’s derivatives traded volume witnessed a slight advance of 20%. Meanwhile, the spot volume has declined by 3.9% in the last 24 hours.
Also, a surge of 7.7% in the token’s derivatives open interest was recorded, showing a rise in the open positions. Also, the token’s market cap value was $664.889M, which resulted in a market cap ranking of #83.
The decline in the spot volume further resulted in lower liquidity in the DYDX token. This makes it difficult to buy or sell the token in different market conditions. Also, the token’s circulating supply was 620.44M DYDX, followed by a total supply of 771.541M DYDX.
The DYDX token price was up by only 26% from its all-time low price, formed just 12 days ago from the press time. Also, the token’s all-time high price was $4.53, which was achieved five months ago.
The token’s security was further medium, resulting in 74.11, which put it in the BBB tier. Also, the token’s security ranking was #1383, as per Certik Skynet, in the global crypto market.
Financial Data Overview Of DYDX Token
Only 1% of the DYDX token holders were in profit, and 97% of them incurred losses at the time of writing. Despite this, the large holders’ concentration in the token was 93%, as the top holders held 87.4% of the total supply.
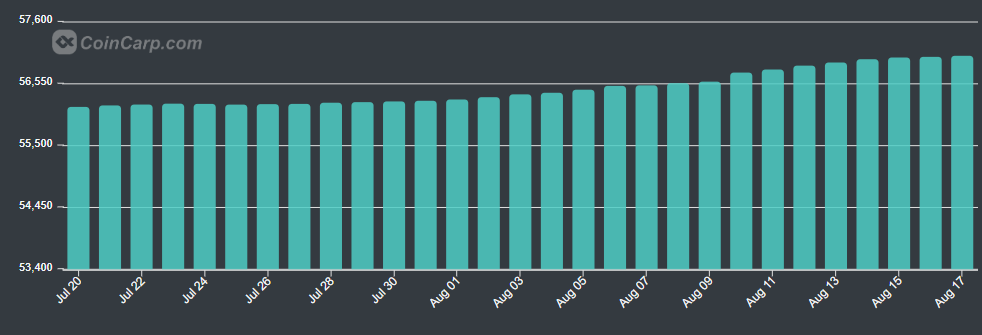
A rise in investors’ confidence can be witnessed as the number of token-holding addresses has consistently advanced over the last few months. Also, the largest token-holding address alone held 54.5% of the total supply.
The total value locked for the token was further valued at $160.08M, which consistently advanced over time. Also, the token’s recorded revenue at press time was $26.1K in the last 24 hours.
DYDX Token Technical Analysis
Over the past few months, DYDX has experienced a steady decline, finding support at a dynamic trendline.
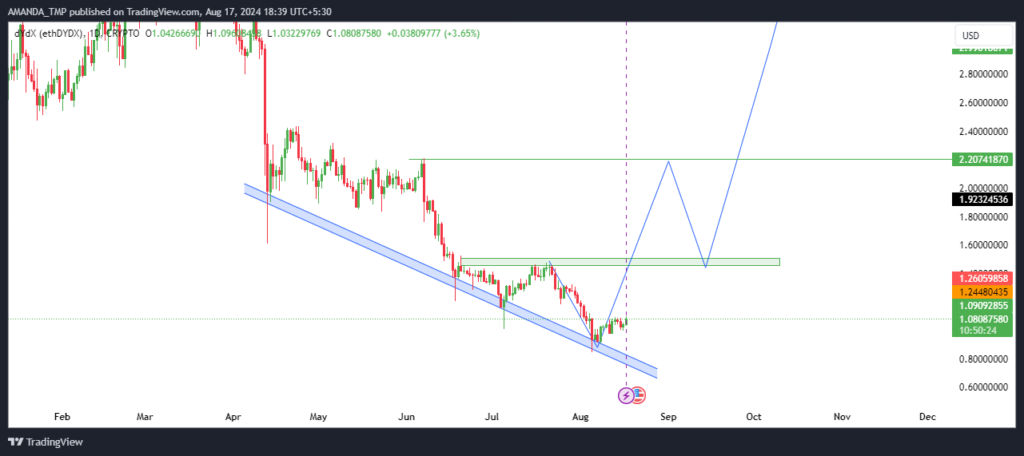
On March 7th, 2024, DYDX reached a swing high of $4.52, after which the token began to face significant profit booking. This led to an 80% drop in value over five months, culminating in a swing low of $0.845, marking an all-time low for the token.
Following this sharp decline, DYDX rebounded slightly, forming a swing high at $1.50. This level could serve as a critical point of reversal, signaling a potential shift in market sentiment.
We could witness a bullish trend if the token price breaks above this $1.50 level and sustains it. It would offer a more optimistic outlook for DYDX’s future performance.
DYDX Token Technical Indicator Analysis
The 50-day and 200-day EMAs recently formed a death cross, signaling a prolonged bearish phase for DYDX.
This was accompanied by the token trading below these key moving averages for an extended period. This pattern underscored the ongoing downward pressure on DYDX’s price.
DYDX/USD Chart by TradingView on
Adding to the bearish sentiment, the MACD and signal line have remained negative, frequently overlapping and creating an environment of uncertainty.
This indecision is further highlighted by the inconsistent histograms appearing on the chart, reflecting the token’s struggle to find a clear direction.
The RSI has also been trending bearish, recently dipping into the oversold zone. As of the latest data, the RSI stands at 45.62, indicating continued weakness in the token’s momentum.
Key support levels for DYDX were positioned at $0.50 and $0.830, while resistance levels were identified at $2.20 and $3.20.
Disclaimer
This article is for informational purposes only and does not provide any financial, investment, or other advice. The author or any people mentioned in this article are not responsible for any financial loss that may occur from investing in or trading. Please do your research before making any financial decisions.




