
 Zerebro
 Bitcoin
 Aerodrome Finance
 ZKsync
 Pearl
Pearl Pudgy Penguins
 Bitway
- The GALA price has surpassed the 20-day moving average and is eyeing for the 200-day EMA.
- GALA crypto price has lost around 75% since April, which showed the bears’ dominance.
As per the chart structure, sellers have shown complete domination since March. They have dragged down the GALA price to the main support level of $0.0150. The price has formed a base near an all-time low.
From the beginning of 2024, the Gala crypto price was bullish and gained around 200% till March. The bullish trend in GALA crypto was interrupted near the $0.0800 territory.
Since March, the digital asset price has declined due to resistance from a descending trendline. Historically, the price has managed to defend the main support level of $0.0150 twice and again. This level has been reached again.
Is a Breakout in GALA Crypto Awaited?
Based on a source on X, the Gala price has reached a crucial level of the breakout. According to the technical chart, the price has been falling due to resistance from the trendline in an 8-H time frame.
$GALA Trendline Getting Weaker,Expecting Breakout✅#GALA #GALAUSDT #Crypto pic.twitter.com/cploQNln8z
— ZAYK Charts (@ZAYKCharts) August 21, 2024
The price has extended to the crucial breakout level as per the chart structure. If it triggers a breakout from the trendline, buyers may be eyeing overcoming the last swing high.
GALA Price Has Shaped a Falling Wedge Pattern on a 1-D Timeframe
The Gala crypto price formed a falling wedge pattern during the daily time frame. It has reached a significant level of breakout from the wedge pattern.
Suppose the digital asset price triggers a breakout from the wedge pattern; it may easily reach the 200-day EMA. Assuming the price overcomes the 200-day EMA, buyers may dominate for a longer period.
On the other hand, suppose the crypto asset price slips below the main support level of $0.0150. If this happens, it will be a strong bearish sign. Selling pressure can be seen below this level, and sellers may drag down the price to a new all-time low.
According to the technical indicators, the GALA price has remained constant. However, the RSI has shown 2x growth, a strong bullish sign. MACD has generated a golden crossover with the signal line, and the histograms have been flipped to green.
Gala Price Analysis
At press time, the GALA crypto was being traded at $0.0178 with an intraday loss of 2.66%. The market capitalization was $596.59 Million, and the 24-hour trading volume was $85.16 Million at the time of writing.
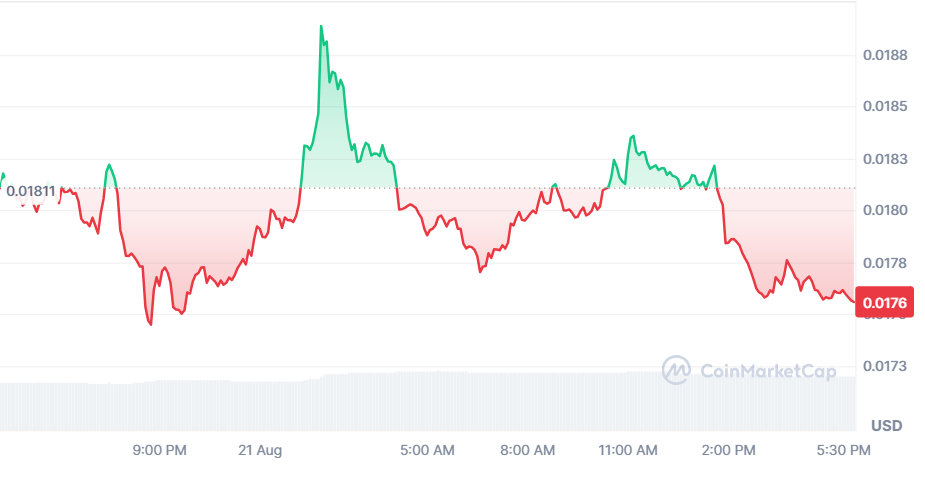
The circulating supply is 34,036,505,615 GALA, and the maximum supply is 36,060,665,751 GALA. It had a fully diluted market cap of $630.25 Million at the time of writing.
GALA Price Forecast
Based on the analysis, it appears that the GALA price is currently at a critical juncture. The possibility of a breakout from the falling wedge patterns suggested a potential for a positive price movement.
The bullish signals from technical indicators such as RSI and MACD further supported this.
However, the crucial support level of $0.0150 should be closely monitored. This is because a breach of this level may lead to further bearish momentum.
Overall, the GALA price is at a pivotal stage. Both buyers and sellers are closely watching for any significant developments in the market.
Disclaimer
This article is for informational purposes only and provides no financial, investment, or other advice. The author or any people mentioned in this article are not responsible for any financial loss that may occur from investing in or trading. Please do your research before making any financial decisions.




