
 Zerebro
 Bitcoin
 Quantus
 Pearl
Pearl Starknet
 ZKsync
 NEAR Protocol
- The FET price has increased by 20% in the past 3 days, demonstrating the buyers’ involvement.
- Fetch.ai price has surpassed the 20-day EMA and is heading toward the 200-day EMA.
The chart structure shows that the FET price has been bullish since 2024. The bullish trend was disturbed near the $3 hurdle in the last week of March and performed negatively further.
From the beginning of April, the digital asset price has been rising by facing resistance from a descending trendline. The crypto asset price has reached the crucial breakout level at press time.
After the bearish momentum, the sellers were exhausted, and buyers took over. According to the chart, the price has found the bottom and has risen by 17% in just 3 days after a small consolidation.
Technical Indicators
The MACD has developed a bullish crossover with the signal line, and the histograms have been flipped to green. The FET price has exceeded the 20-day EMA and is eyeing for the 200-day EMA.
RSI is 50 and has shown a bullish divergence, indicating bullish momentum. The Fetch.ai crypto price has remained constant. However, the RSI has displayed continuous growth, demonstrating a bullish forecast.
Could the FET Crypto Reach New ATH After Retest?
A source on X claimed that the Fetch.ai crypto price is retesting the previous ATH level. On a weekly time frame, the price has risen by forming lower lows and lower highs.
#FET $FET retesting Previous ATh As support
— Kings Charts (@KingsCharts) August 21, 2024
Holding 0.75 0.8 area
2.4 or new ATH
Buying $FET between 0.9 0.8@CryptoWizardd send it new ath pic.twitter.com/YwtqJ6eodi
The price has reached the lower low territory and has formed bullish candlesticks. According to this source, the buying zone would be between the $0.90 and $0.80 levels. It is expected to record a new all-time high as it departs from the previous ATH zone.
FET Price Analysis
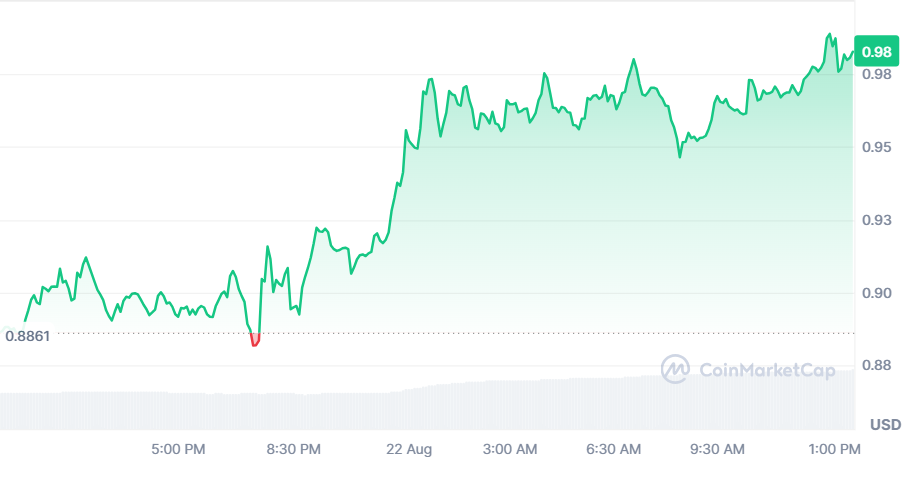
At press time, the Fetch.AI crypto was being traded at $0.98, gaining 2.08% in the past 24 hours. It has a market capitalization of $2.47 Billion, and its 24-hour trading volume is $150.50 Million.
FET Price Has Formed a Falling Wedge Pattern on a Daily Timeframe
During the daily time frame, the FET crypto price has shaped a falling-wedge pattern and reached the breakout level. Buying pressure can be anticipated if the digital asset price triggers a breakout from the wedge pattern.
Assuming the crypto asset price manages to surpass the 200-day EMA, strong buying pressure can be seen. Suppose the chart structure attracts investors, and then the price may remain bullish for longer.
On the other hand, buyers may lose hope if the digital asset price slips below the 20-day EMA. It could start trading below the $0.75 level. The price below this level would be a bearish sign and may keep falling.
FET Price Forecast
Based on the technical indicators and price analysis, it seems that the FET crypto price is at a crucial point for a potential breakout. The recent increase in price and bullish indicators suggest a positive momentum.
If the price surpasses the 200-day EMA and holds above key support levels, it could lead to a sustained bullish trend.
However, closely monitoring the price movement is important, especially around the $0.75 level. This is because a drop below this could indicate a bearish trend.
Disclaimer
This article is for informational purposes only and provides no financial, investment, or other advice. The author or any people mentioned in this article are not responsible for any financial loss that may occur from investing in or trading. Please do your research before making any financial decisions.




