
 Zerebro
 Bitcoin
 Pudgy Penguins
 NEAR Protocol
 Quantus
 Pearl
Pearl ZKsync
- Klay price has surged by 70% from this month’s low and extended to the 200-day EMA.
- Sellers have failed to reverse the trend from the lower high territory, which showed the bulls’ grip.
In a broader time frame, the KLAY price has settled to the bottom and has undergone a consolidation phase. The Klaytn price reached a multi-year low on August 05 and displayed price rejection.
In the second quarter of 2022, the KLAY price witnessed a sharp selling of 80% in two months. The price has undergone a long consolidation phase for 2 years. However, the buyers have attempted many times to overcome the $0.325 mark but couldn’t.
Historically, the Klaytn crypto price has managed to defend the major support level of $0.110 huddle. The Klaytn price has declined in the short term due to resistance from a descending trendline.
Can We Get 2X Return After the Breakout?
$KLAY Looks Pretty solid the Wedge upside breakout so Keep an eye on it..
— Captain Faibik (@CryptoFaibik) August 20, 2024
Expecting 2x Bullish Rally in Coming days.. #Crypto #KLAY #KLAYUSDT pic.twitter.com/GC1T2QAmwe
A source on X claimed that the KLAY crypto price has a solid mood of breakout. The KLAY price has formed a complete wedge pattern, reaching the crucial breakout level. After a successful breakout, the price is expected to gain 2x return in a few days.
KLAY Price Analysis
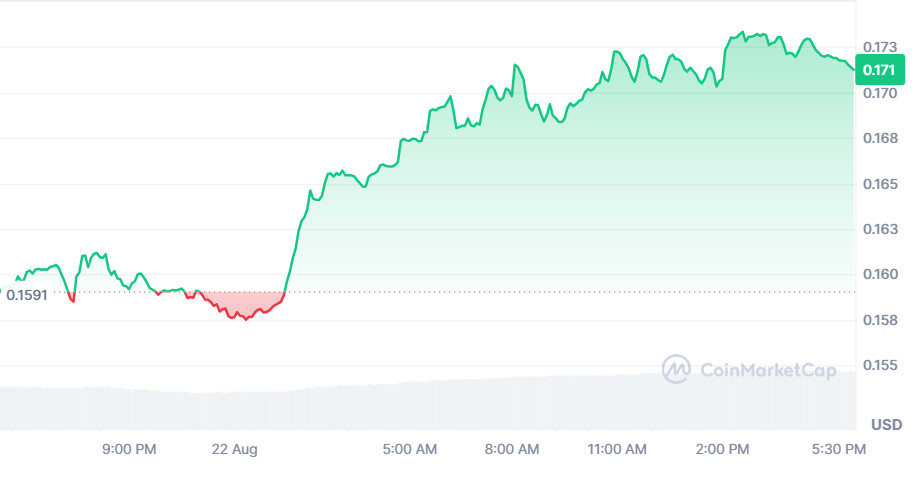
Klaytn crypto was being traded at $0.171 at press time, which has risen by 2.40% in the past 24 hours. The market capitalization was $650.09 Million, and the 24-hour trading volume was $2.19 Million at the time of writing.
KLAY Price has Shaped a Falling Wedge Pattern
Based on the technical chart, the Klaytn price has formed a falling wedge pattern on a daily time frame. However, it has triggered a breakout from the wedge and has extended to the 200-day EMA.
At press time, the bullish momentum has interrupted near the 200-day EMA. If the digital asset price surpasses the 200-day EMA, buyers may keep dominating. The bullish momentum can be boosted if the trading volume increases during a breakout.
Alternatively, if the price faces resistance from the 200-day EMA, then buyers might panic. Suppose the price drops below the upper trendline. It would turn into a fake breakout.
A fake breakout might result in massive selling pressure because the buyers at the breakout got trapped. If the price slips below the $0.120 mark, sellers may be eyeing a new all-time low.
According to the technical indicators, the RSI has rapidly recovered from the oversold zone and has reached the overbought zone. Most of the technical indicators are in favor of bullish forecasts.
Klaytn Price Forecast
The KLAY price has shown a significant breakout from the trendline and has reached the crucial 200-day EMA level. Technical indicators suggest a bullish forecast, and the price has surged by 70% from this month’s low.
However, monitoring the potential resistance at the 200-day EMA level is important. If the price surpasses this level and trading volume increases, it could indicate a sustained bullish momentum.
On the other hand, a failure to maintain momentum could result in a fake breakout, leading to selling pressure. The RSI and other technical indicators support a bullish outlook.
Disclaimer
This article is for informational purposes only and provides no financial, investment, or other advice. The author or any people mentioned in this article are not responsible for any financial loss that may occur from investing in or trading. Please do your research before making any financial decisions.




