
 astronaut
 Walrus
 Pearl
Pearl Bitcoin
 NEAR Protocol
 Zcash
Zcash Hyperliquid
- The Rune price has risen by 38% in the past 12 days, triggering a breakout.
- Sellers have failed to drag down the price below the 20-day EMA in the lower-high territory.
The technical chart showed that the rune price has been on a bearish trend for the past few months. It has declined by facing resistance from a descending trendline. The price has made many attempts to exceed the trendline but couldn’t.
Since March, the digital asset price has declined by defending a falling trendline. The THORChain price has failed to defend the last swing high since March, which indicated the sellers’ strength.
The price has bounced back from the lower low territory and has surpassed the 20-day EMA. After a small consolidation at the crucial level, the price has cleared its direction with a strong positive candlestick.
Can the Rune Price Surge After Retest?
A source on X claims that the Rune crypto price has shown weakness and has failed to surpass the trendline. The THORChain price is expected to shoot up soon after the breakout and retest.
$RUNE
— ₿yron Froneman (@BFronos) August 23, 2024
Daily chart. Doesn't get more simple than this.
Flip trend, hold retest, and long #Rune pic.twitter.com/QG1fCbhFhX
THORChain Price Overview
At press time, the THORChain price was being traded at $4.18, surging by 6.06% in the past 24 hours. It has a market cap of $1.40 Billion, and its 24-hour trading volume is $168.02 Million.
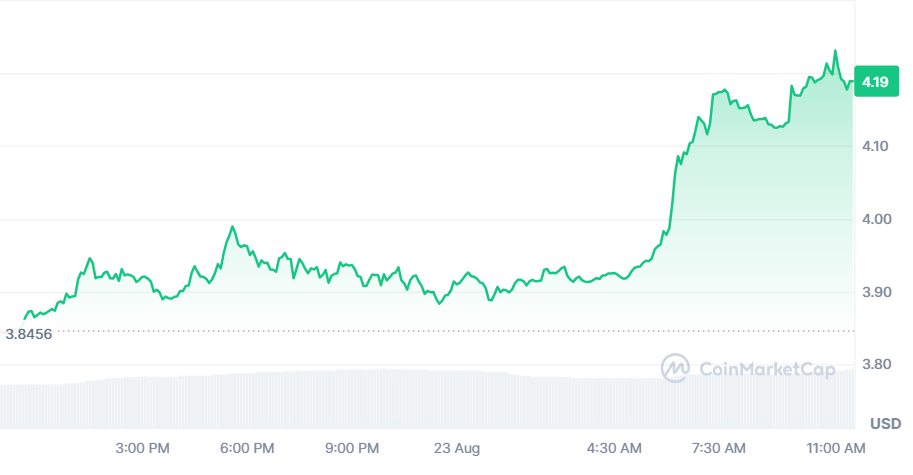
The fully diluted market cap was $1.73 Billion at the time of writing. The circulating supply is 334,979,688 RUNE, and the total supply is 413,721,264 RUNE.
RUNE Price Has Formed a Wedge Pattern on a Daily Timeframe
As per the chart, the RUNE price has shaped a falling wedge pattern on a daily time frame. It has reached a crucial breakout level and almost exceeded the upper trendline.
If the digital asset price surpasses the upper trendline, buyers may become interested. Investors might get involved if the price starts trading over the 200-day EMA. The involvement of investors may lead to strong buying momentum.
On the other hand, if the Rune price faces resistance from the upper trendline, sellers may easily drag down the price to the lower one. If the price loses the support level of $3, sellers may dominate for longer.
Based on the technical indicators, the RSI has shown bullish divergence and is rapidly heading for the overbought zone. The price has surpassed the 20-day EMA, and buyers are eyeing for the 200-day EMA.
RUNE Price Forecast
Based on the technical analysis, the Rune price has shown potential for a breakout and could reach double digits soon. The price has formed a falling wedge pattern on a daily timeframe and is on the verge of surpassing the upper trendline.
Strong buying momentum may be expected if the price exceeds this level, especially if it starts trading over the 200-day EMA.
However, if the price faces resistance and drops below the support level of $3, sellers may dominate for a longer period.
Additionally, the RSI has shown bullish divergence, indicating a potential upward move. The price has surpassed the 20-day EMA, with buyers eyeing the 200-day EMA.
Disclaimer
This article is for informational purposes only and provides no financial, investment, or other advice. The author or any people mentioned in this article are not responsible for any financial loss that may occur from investing in or trading. Please do your research before making any financial decisions.




