
 Zylo Ecosystem
 Pearl
Pearl Walrus
 Derive
 Quantus
 Aerodrome Finance
 Sui
Sui
- The Stacks price has shown weakness in the lower high zone, indicating a bearish forecast.
- The STX crypto price has faced resistance from the 200-day EMA and lost 15.57% in 3 days.
Looking at the technical chart, the Stacks price prediction suggested a bearish forecast. Since April, the price has declined in lower lows and lower highs format and has slipped below the key moving averages.
The bearish trend in Stacks (STX) crypto seems to be halted near the major support level of $1.25. Since July, the buyers have defended this level twice, indicating that sellers have exhausted and the momentum could be shifted in buyers’ favor.
The digital asset price recorded an all-time high of $3.84 on April 1, 2024. The bullish trend was interrupted near this level, and the momentum was transferred to the bulls.
Based on the long-term perspective, the STX price was bullish and underwent a correction phase. However, sellers have dominated in the short term, and RSI has failed to sustain over 60.
Stacks Crypto Price Overview
Stacks crypto was being traded at $1.61 at press time, which has remained neutral for the past 24 hours. The market capitalization was $2.39 Billion, and the 24-hour trading volume was $137.79 Million.
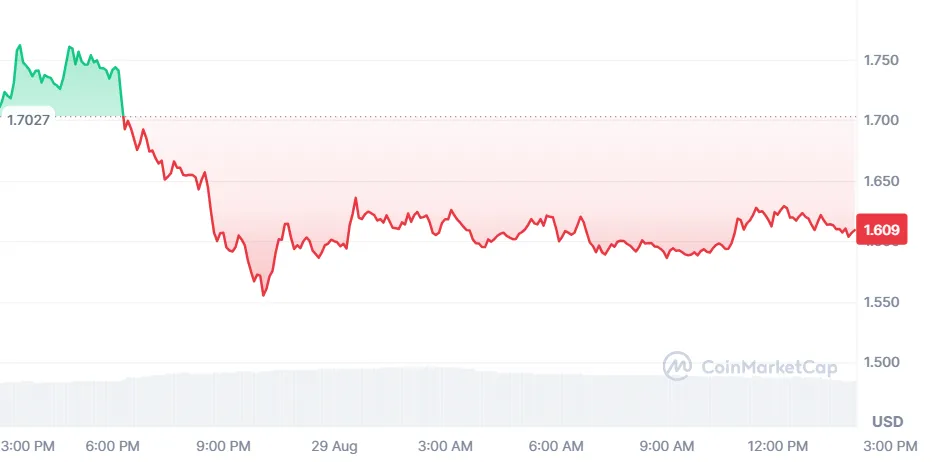
Stacks Price Has Stuck in Bulls and Bears Existence; What’s Next?
David Keller, CMT (@DKellerCMT), has tweeted that the buyers and sellers are in a battle for control. In a broader time frame, the STX crypto price has performed positively and has undergone a correction phase. It is expected to be a huge gain after the breakout and may record a new all-time high.
$STX still look good from long-term trend perspective, but in the short-term I’m seeing a lower high and an RSI that did not push above the 60 level. Both signs of a downside trend reversal. pic.twitter.com/m5RkKkGQp6
— David Keller, CMT (@DKellerCMT) August 28, 2024
In the short term, it seems that the buyers have lost momentum, and sellers have been dominating since April. It has been declining by forming lower lows and lower highs. At press time, the price was trading in the lower high territory and showed weakness, a bearish sign.
Would the STX Price Decline More or Reversal on Its Way?
The Stacks crypto price has declined in a descending channel during the daily time frame. However, it triggered a breakout from the channel and came for the retest. At the time of writing, the price was struggling between the 20-day and 200-day EMA.
Suppose the digital asset price takes support on the 20-day EMA and surpasses the 200-day EMA; It would be a buying signal. A trend reversal can be anticipated if the price smashes the $2.50 hurdle.
If the STX price slips below the channel, it may be considered a fake breakout. Due to the fake breakout, the crypto asset price may witness strong selling pressure because of the liquidity.
Based on the technical indicators, the price was trading below the key moving averages, demonstrating the bears’ forecast. RSI has triggered a bearish crossover with the RSI-based moving average, showcasing the bearish momentum.
Stacks Crypto Price Forecast Based on Technical Chart
The Stacks price has witnessed bearish momentum since April after reaching an all-time high. The price has dropped below the key moving averages, which indicates that the buyers have lost momentum.
The price has undergone a correction phase by analyzing a weekly time frame and may perform positively after the breakout. Stacks price prediction indicates the bearish forecast based on the chart structure and technical indicators.
Disclaimer
This article is for informational purposes only and provides no financial, investment, or other advice. The author or any people mentioned in this article are not responsible for any financial loss that may occur from investing in or trading. Please do your research before making any financial decisions.




