
 NEAR Protocol
 Pyth Network
 Uniswap
 Pearl
Pearl Quantus
 Aerodrome Finance
 Starknet
- Starknet price witnessed a strong trading activity surge in the last 24 hours.
- The STRK token had huge liquidity compared to its market cap.
Starknet’s (STRK) price has recorded a surge of 150% in the last 24 hours from the press time. This resulted in a traded value of $f163.409M.
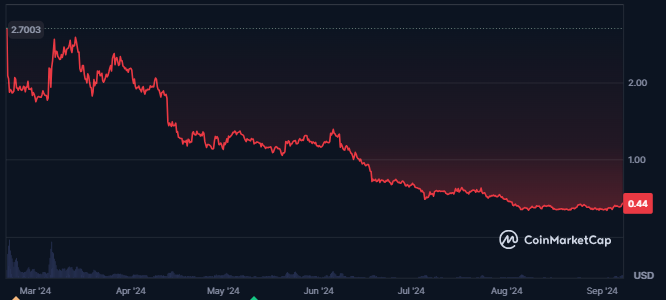
The huge surge in the crypto’s volume led to massive liquidity in the STRK price. It was followed by a volume/market cap ratio of 21.25% at press time.
The STRK crypto’s market cap advanced 7.6% in the last 24 hours, resulting in $776.932M. The token’s market cap ranking was #72 at press time, followed by a market cap dominance of 0.04%.
STRK crypto’s derivatives volume recorded a surge of 181%. This resulted in a traded value of $430.61M.
The Starknet token’s open interest also advanced by 25% in the last 24 hours. It showed a rise in the token’s open positions, showing a surge in investors’ interest.
What Does In/Out Of The Money Data Say About The Starknet Token?
The Starknet token had 14.2K holders at press time, and 72% were out of money (witnessing loss). Additionally, the large holder’s concentration in the token was 90%. This happened as the token’s top 10 holders had 62.06% of the supply.
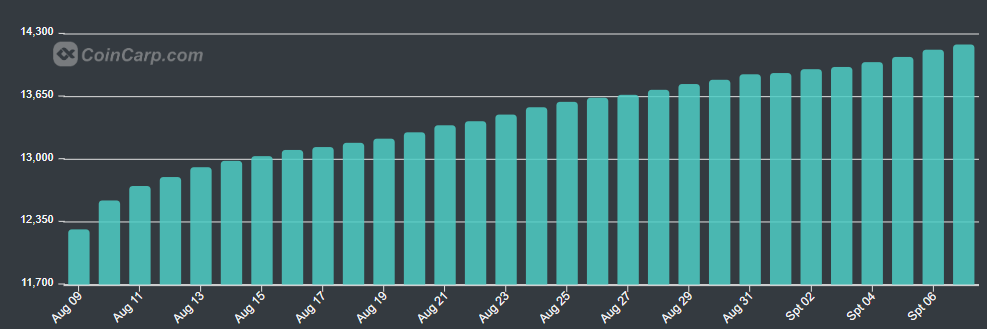
A rise in the total number of STRK crypto holders was recorded, which showed an increase in investors’ confidence. Also, 4% of the token’s holders had held it for over a year.
The token’s total value locked was valued at $238.73M, and the stablecoins market cap was worth $93.33M.
Starknet Price Breaks Above Crucial Levels, What Should Be The Plan Of Action?
Over the past six months, the STRK price has experienced significant profit-taking. This led to a steady formation of lower lows on the price chart. This consistent downward pressure resulted in a more than 90% decline in the token’s value during this period.
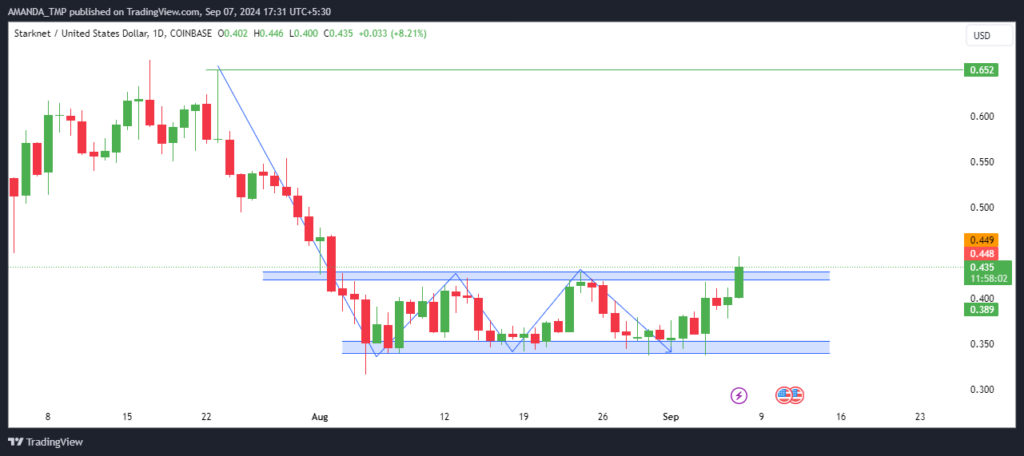
In recent price action, the STRK price has been trading within a tight consolidation zone for the past month, reflecting a period of reduced volatility. However, the price has now broken out of this consolidation zone. It signaled a potential shift in momentum as the token exhibited bullish behavior.
This breakout suggested a possible reversal from the prolonged bearish trend. It was accompanied by the market showing early signs of renewed buying interest in the STRK crypto.
Are technical indicators opposing the STRK price structure?
The STRK crypto has been in a prolonged downtrend, with its price consistently trading below key EMAs. The 20-day and 50-day EMAs have formed a death crossover, steadily declining to lower levels. This reflected the persistent bearish sentiment.
STRK/USD Chart by TradingView.com
The MACD indicator has also provided a strong sell signal, with the MACD and signal lines trending negatively. The MACD histograms further highlight the weakness in price action, confirming the ongoing bearish momentum.
Additionally, the RSI recently encountered resistance at the 50 level. It has since dropped to lower levels, falling below the 14-day SMA. This decline reinforced the downward pressure on the token, further supporting the overall negative trend.
Looking ahead, STRK may find support at $0.10 and $0.30. In contrast, resistance levels will likely be at $0.60 and $1.00. These levels will be critical in determining the STRK price’s future direction.
Disclaimer
This article is for informational purposes only and does not provide any financial, investment, or other advice. The author or any people mentioned in this article are not responsible for any financial loss that may occur from investing in or trading. Please do your research before making any financial decisions.




