
 Zylo Ecosystem
 Pearl
Pearl Walrus
 Derive
 Quantus
 Aerodrome Finance
 Sui
Sui
- Quant ranked as the 70th largest cryptocurrency in the global crypto market at the time of writing.
- QNT price was outperformed by 93% of the top 100 crypto assets in the last 1 year.
The Quant(QNT) price witnessed solid buying, which led the token price to higher levels.
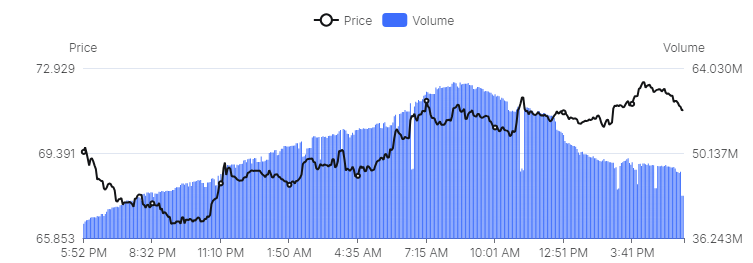
The intraday volume chart of SpotonChain for Quant crypto shows that the volume has surpassed the value of $60.0M. This showed strong activity in the token. Moreover, the token’s traded volume advanced by more than 100% in the past 24 hours.
QNT price today traded at a level of $70.75 at press time, and the price consistently advanced with volume. This showed a strong rise in the token’s demand, which might lead to differences in the QNT price prediction.
The Quant token’s market cap value was $854.252M, and its market cap dominance was 0.04%. The token’s price volatility was also medium at 4.51%, which showed stability of the price in the future.
The Quant crypto price sentiment was neutral, and the fear and greed index was at 26. That showed fear among the token’s investors while the price drove to higher levels.
What Activity Does the Onchain Data Signify in the QNT Price?
In the last seven days, an increase in the centralized and decentralized exchanges was recorded. It showed that a larger sum of money was entering the token’s ecosystem.
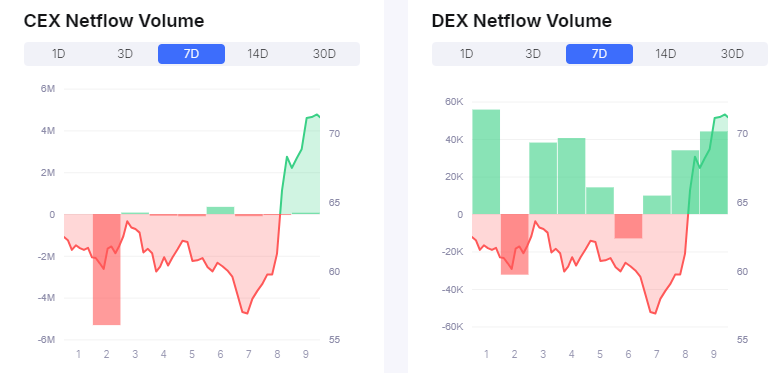
Moreover, Quant token had a total of 150.3M holders at press time. Moreover, 28.71% of the supply was held by the top 10 QNT holders. The token’s price correlation with Bitcoin was 0.94. Also, in the last seven days, inflows worth $1.52M were recorded in the token.
The token’s security score was average at 77.27. The CertiK Skynet data showed its global security ranking at #1004, which led it to be a part of BBB tier.
QNT Price Breaks Above Significant Levels. What’s Ahead?
The QNT price traded more than 50% below its all-time high price. That indicated a strong downtrend in the token price, which has continued for the last five months.
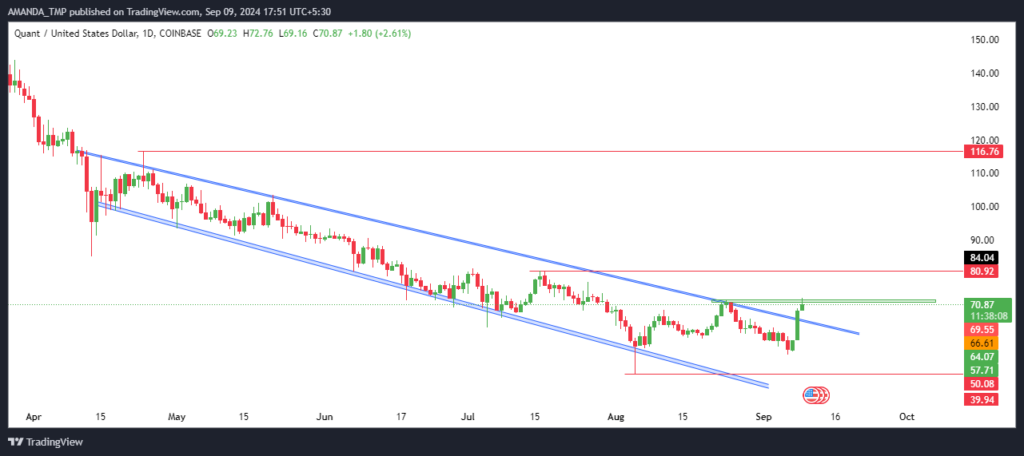
Since the Quant price traded in a strong downtrend for a long time, a falling wedge pattern was formed on the daily chart.
The token price broke out above the falling wedge pattern. A breakout in price was followed by a strong surge in volume, which showed a reliable price breakout.
Let’s Further Look Into the Technical Indicators of Quant Token
The EMAs on the QNT token’s daily chart exhibited a bearish trend as the 50-day and the 200-day EMAs traded in a death cross. Moreover, the price traded below the 200-day EMA at press time.
QNT/USD Chart by TradingView
The MACD and the signal line formed a bullish crossover on the chart. Despite this, the mentioned metrics traded in the negative trajectory and there was a formation of bullish histograms.
The RSI showed a surge in bullish momentum as it advanced to the 60.5 level. It was followed by the breakout above the 14-day SMA, which indicated optimism in price.
The QNT token price might witness support at the levels of $40.0 and $57.0, and it may face resistance at the $81.0 and $116.0 levels.
Disclaimer
This article is for informational purposes only and does not provide any financial, investment, or other advice. The author or any people mentioned in this article are not responsible for any financial loss that may occur from investing in or trading. Please do your research before making any financial decisions.




