
 Bitcoin
 Solana
 Pearl
Pearl Zerebro
 Aerodrome Finance
 LayerZero
 NEAR Protocol
- Akash Network (AKT) price has experienced a decline in recent weeks, failing to capitalize on optimistic integration with NVIDIA.
- Futures market data suggests bearish sentiment with a negative funding rate and declining open interest.
- The overall outlook for Akash Network remains bearish, with the potential for further price declines if the current support levels are breached.
Akash Network (AKT) price has decreased by 4.8% in the last 24 hours, and the 20-day EMA deflected it. It failed to gain traction over a couple of weeks and struggled beneath the significant downward trend.
The Akash Network price has remained bearish in the quarter of 2024 despite its integration into NVIDIA’s latest product, Brev. It has stayed near the $2 mark below the key EMA bands and showcased bearish pressure.
The token has faced considerable setbacks amid Nvidia’s bearish slump. The downward trend has been looking intact, which confirmed sellers’ dominance. How will it perform in the coming weeks? Let’s find out.
AKT Token Technical Analysis
In the year-to-date (YTD) period, AKT displayed a strong bullish trend with a consistent uptrend. This consistent positive movement drove the price to $6.50 by the first quarter of 2024.
Thereon, the AKT price experienced 5-month strong sell-offs from profit bookers from its elevated levels. This led to a decline toward the $1.80 mark by August 5th.
However, the price has found a strong support zone at this level. It tried to form a higher high swing from this zone, which failed due to strong bearish pressure.
The AKT crypto noted a 25% drawdown in the last 14 days, considerably impacting investors. The rejection met around the $3 mark, trapped the bulls, and smashed its price back to the demand zone.
At press time, the Akash Network price traded at $2.32, with an intraday decline of 4.8%. Its market cap has declined, reaching $581.2 Million, and it witnessed a 25% decline in spot volume inflow.
The volume amounted to $8.054 Million, and the market cap ratio was 1.44%. This defines its weak liquidity, which could trouble trading activity due to a lack of liquid present.
Suppose the AKT crypto breaks above the $3.00 level and sustains above it on the daily chart. The possibility of flipping the current trend might surge. Such a spark in price would potentially attract more investors. It would reinforce the bullishness and potentially drive the AKT to new elevations.
However, failure to sustain the current demand zone under bearish dominance could lead AKT to plunge even more.
Therefore, based on the AKT price structure, the support lies at $2.0 and $1.821. This was followed by the resistance levels of $3.0 and $3.86, respectively.
AKT Indicators Outlook & Future Forecast
On the daily chart, the 200-day and 50-day EMA bands have traded in a death cross. Moreover, the MACD and the signal line traded below the zero line with a histogram at 0.0024.
Likewise, the RSI was at 43.11. The indicators displayed a lack of momentum and prevailing uncertainties related to the Akash Network price.
Futures Market Data Indicates Bearish Cues
According to the Coinglass data, the funding rate was noted in red at 0.1112%. This underscored the bearish sentiment.
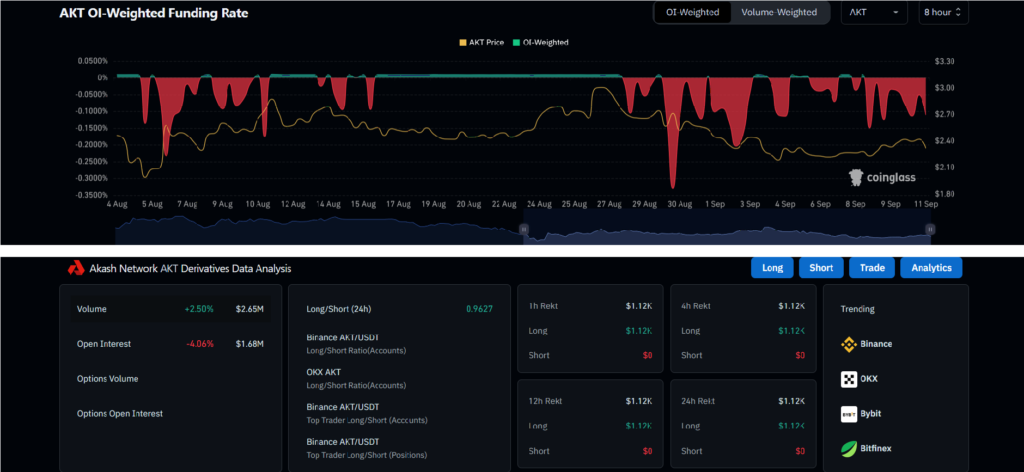
Similarly, the Open Interest shed over 4.06% to $1.68 Million. It conveyed signs of higher long unwinding activity in the past 24 hours.
Meanwhile, for the bearish trend, the volume exceeded 2.50%, amounting to $2.65 Million. The long/short ratio was 0.9627, signifying the bears’ dominance.
The shorts were surprisingly liquidated at $0 intraday, which showed zero interest by buyers. However, the longs were higher at $1.12K, signifying the bears could push more towards lows.
Disclaimer
This article is for informational purposes only and does not provide any financial, investment, or other advice. The author or any people mentioned in this article are not responsible for any financial loss that may occur from investing in or trading. Please do your research before making any financial decisions.




