
 Zerebro
 Bitcoin
 Pudgy Penguins
 NEAR Protocol
 Quantus
 Pearl
Pearl ZKsync
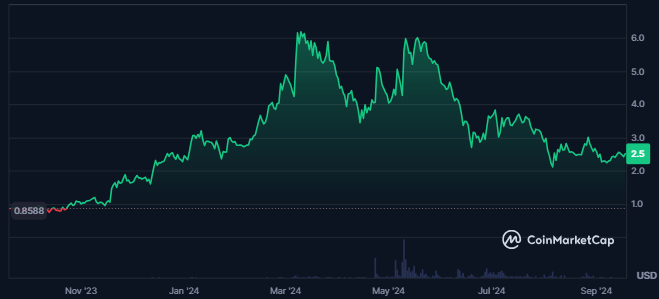
- The Akash Network crypto price traded 69% below its all-time high price.
- The AKT token price advanced by 190% in the last 1 year.
Akash Network (AKT) price has been trading in a prolonged downtrend. The formation of the bearish patterns on the technical chart marked this decline. However, recent market movements suggest a potential shift.
Could the AKT price be on the verge of a breakout? Let’s dive into key metrics and explore how the price could behave.
AKT Price Trends: Volume Surge and Metrics
The traded volume value for the AKT crypto has witnessed an advance of 58.36% in the last 24 hours from press time. This represents an advance in crypto trading activity.
Following the advance in the trading volume, the token’s market cap also advanced by 4.6%. This cryptocurrency ranked #95 based on its current market cap, as per CoinMarketCap.
The token’s price volatility was high, resulting in 6.8%. This indicated that the AKT price might lead to uncertain moves. Additionally, the token’s market cap dominance was 0.03%, and its supply inflation was 13.61%, which is considered high.
The security score of AKT crypto was high, resulting in 83.60. This showed a strong and secure protocol for the token. It also belonged to the A tier as per Certik Skynet, ranking #438 globally.
AKT Crypto Witnesses Rise in Activity
A surge of 51% in the AKT crypto was recorded in the last 24 hours, resulting in a traded value of $3.26M. Despite this, the open interest in the token declined by 21.9%, showing a decline in open positions. This could signify a decline in traders’ confidence in the token.
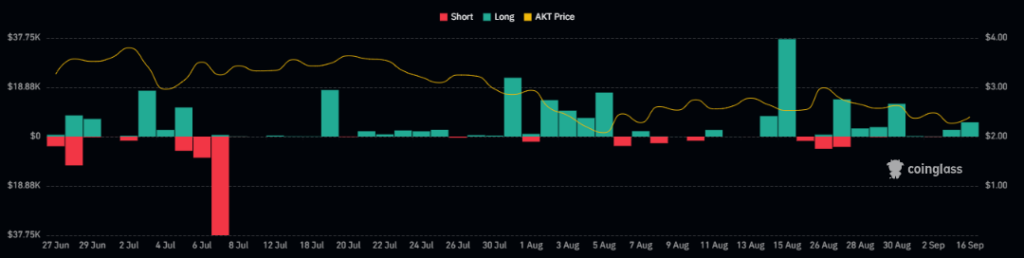
Moreover, longs worth $1.18K were liquidated in the token in the last 24 hours. Against this, none of the shorts were liquidated in the token. This presented a strong seller dominance in the Akash Network price.
What Does the Technical Chart Represent About the AKT Price?
A broader analysis of AKT crypto over a larger timeframe revealed a once-strong bullish trend. The trend appears to be losing momentum due to the recent price decline. This shift in sentiment has resulted in a weakening of the overall upward trajectory.
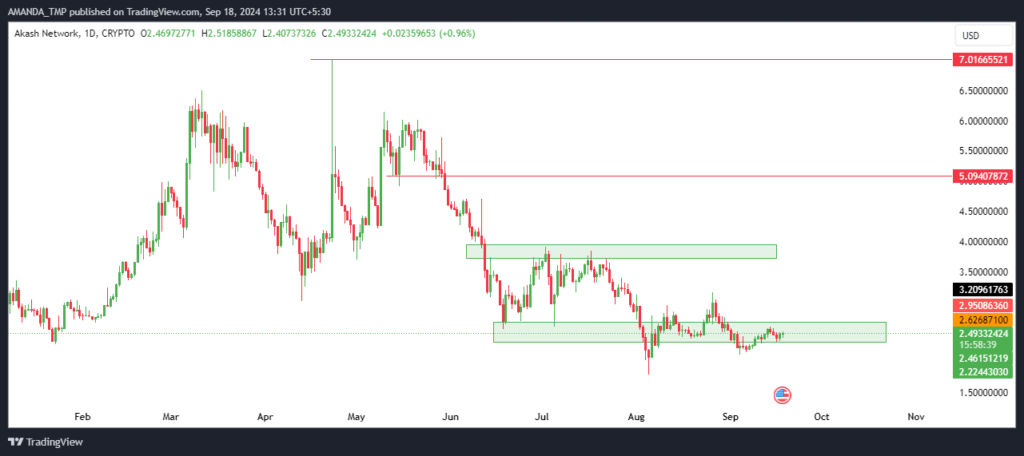
The token has begun forming lower low swings on the daily chart, signaling a shift toward bearish price action.
Let’s Further Analyze The Technical Indicators Of The Akash Network Token
On the daily chart, the 50-day and the 200-day EMAs traded in a death cross. Following this, the Akash Network price traded below the EMAs, which showed a strong downtrend.
AKT/USD Chart by TradingView
The MACD indicator showed a neutral behavior, and the MACD and the signal line traded in a negative trajectory. Despite this, both the metrics are in a bullish cross.
The RSI hit the 50-level at press time and had crossed above the 14-day SMA. This showed a rise in the token’s bullish momentum, which might help the price in advance.
The AKT price might take support at $0.580 and $1.80, followed by the resistance levels of $5.090 and $7.00.
Disclaimer
This article is for informational purposes only and does not provide any financial, investment, or other advice. The author or any people mentioned in this article are not responsible for any financial loss that may occur from investing in or trading. Please do your research before making any financial decisions.




