
 NEAR Protocol
 Pyth Network
 Uniswap
 Pearl
Pearl Quantus
 Aerodrome Finance
 Starknet
- Bitcoin has outperformed 67% of the top 100 crypto assets in the last 1 year.
- The BTC price witnessed higher short liquidations in the last 24 hours.
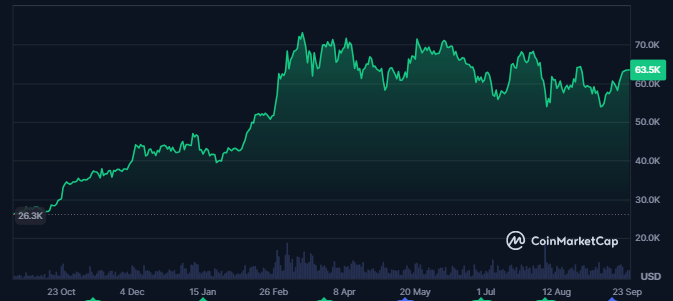
The Bitcoin (BTC) price has experienced notable growth over the past one year. This surge in BTC price was driven by low supply inflation and increasing investor interest.
With bullish market sentiment and a potential breakout on the horizon, Bitcoin remains the most dominant cryptocurrency. This analysis delves into the coin’s performance, derivatives activity, and key technical indicators.
Let’s Assess What the BTC Price Data Indicate
When writing, Bitcoin’s supply inflation remains notably low at 1.34%, positioning it as an attractive asset for investors. The sentiment surrounding Bitcoin was bullish. Its Fear and Greed Index at a neutral 50, indicating balanced investor sentiment.
Over the past year, Bitcoin has experienced significant growth, with its price increasing by 135%, trading at $63,440 at the time of writing. Its market capitalization was $1.253 Trillion, solidifying its status as the largest cryptocurrency by market cap.
The Bitcoin crypto price has shown stability, supported by a medium liquidity level of 3.71%. With a market cap dominance of 56.43%, Bitcoin maintains its position as the dominant force in the cryptocurrency market.
In the last 24 hours, the coin’s traded volume surged by 96%, reaching a total of $27.961 billion. This increase highlighted the substantial liquidity within Bitcoin. It contributed to a fully diluted market cap of $1.331 trillion.
Bitcoin boasted a total of 54.337 million holders at press time, with the top 10 holders controlling 5.66% of the total supply. Notably, there has been a recent increase in the number of holders. It further indicated growing interest and confidence in Bitcoin’s future prospects.
Do Bitcoin’s Derivatives Indicate An Upcoming Breakout?
In the past 24 hours, Bitcoin derivatives data recorded a substantial increase in trading activity, with traded volume surging by 134%.
This spike brought the total traded value to $56.33 Billion. It signaled heightened interest and activity in Bitcoin’s derivatives market. Alongside this, open interest also saw a modest increase of 1.2%, indicating a rise in the number of open positions.
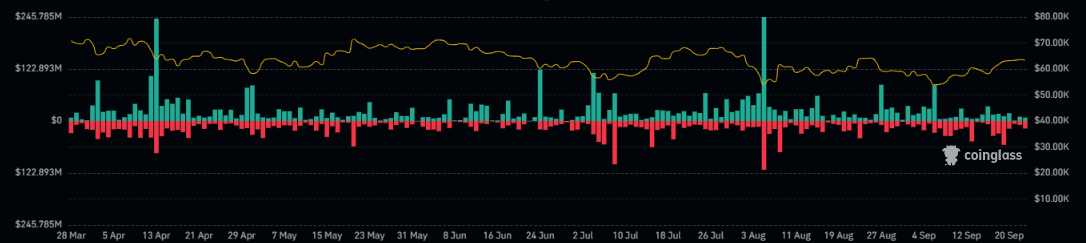
In terms of liquidations, long positions worth $14.59 Million were liquidated within the same period. On the other hand, short positions faced significantly higher liquidations, amounting to $26.50 Million.
This imbalance suggested that buyers exert more influence over the market, as evidenced by the larger liquidation of short positions, reflecting buyer dominance in Bitcoin’s price action.
What’s Going on with Bitcoin Technicals?
The BTC price has been trading within a dynamic range for the past five months. It showed a slight downward bias. This prolonged consolidation period has led to a falling wedge pattern on the daily chart.
Despite the current pattern formed on the technical chart, Bitcoin is approaching higher levels. That Might lead to a breakout in the future.
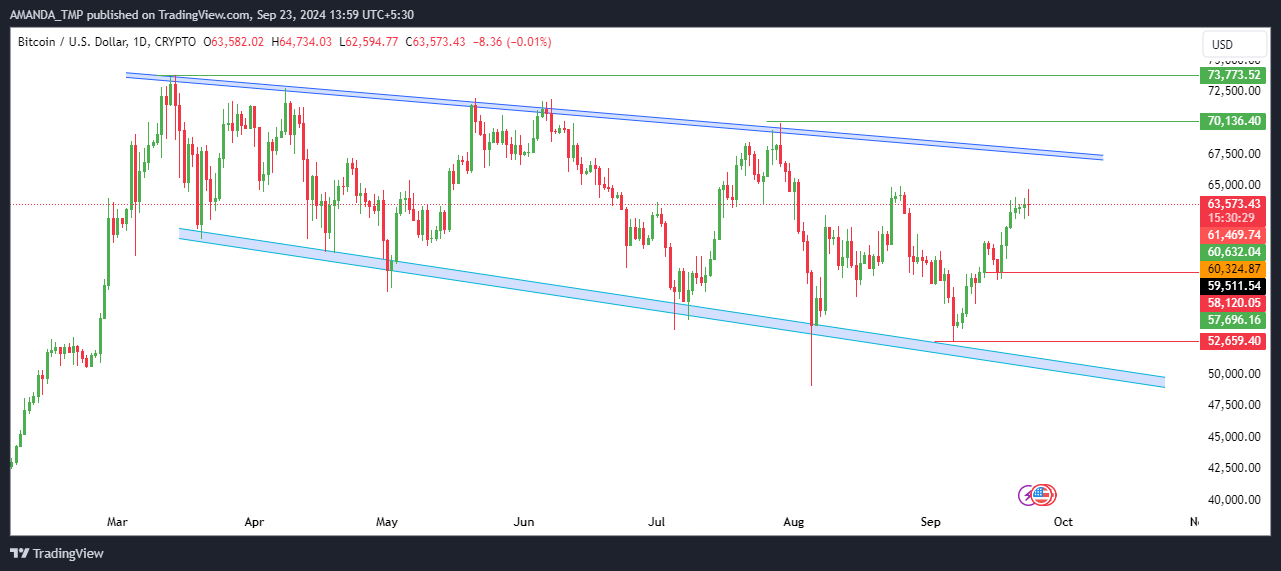
Additionally, multiple bullish candles are consistently formed on the coin’s daily chart. It might also lead the coin price to higher levels, which is approaching the upper band of the wedge pattern.
If the Bitcoin price breaks above the pattern with strong momentum and holds above it, a continuation of the price trend is likely. This could potentially lead to new all-time highs.
What the Technical Indicators Reveal about BTC Price
The BTC crypto price is trading above the 50-day and the 200-day EMA. Following this, the EMAs also traded in a golden crossover, exhibiting a strong bullish character of the price trend.
BTC/USD Chart by TradingView
The MACD and the signal line traded in a golden crossover and advanced to the bullish trajectory. It showed the dominance of bulls in the price, followed by the formation of bullish histograms.
The RSI advanced to the level of 62, breaking above the 14-day SMA. This indicator also sustained above the 50 level, exhibiting a rise in bullish momentum.
The BTC Price price might take support at the levels of $52,650 and $58,200, and it may face resistance at the $71,130 and $73,700 levels.
Disclaimer
This article is for informational purposes only and does not provide any financial, investment, or other advice. The author or any people mentioned in this article are not responsible for any financial loss that may occur from investing in or trading. Please do your research before making any financial decisions.




