
 astronaut
 Pearl
Pearl Hyperliquid
 Walrus
 Pudgy Penguins
 Bitcoin
 NEAR Protocol
- Near Protocol token had a very strong market presence.
- NEAR token outperformed 86% of the top 100 crypto assets in the last 1 year.
Near Protocol (NEAR) has emerged as a dominant player in the cryptocurrency market. It has consistently ranked among the top assets.
NEAR price has surpassed many of its peers with remarkable liquidity, robust market cap growth, and rising trader activity. With momentum building, all eyes are on where the NEAR price is headed after the breakout.
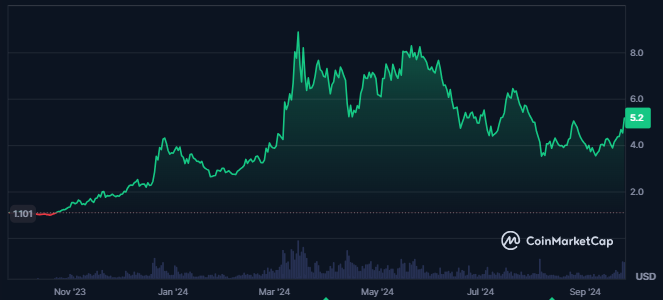
NEAR Price: Market Position And Performance Insights
NEAR Crypto has solidified its position as the 17th largest cryptocurrency in the global market. It underscored its significant market presence. This prominence was reflected in the protocol’s market cap dominance of 0.26%. The token’s total market capitalization was valued at $5.856 Billion.
The token has shown remarkable liquidity, as 12.6% of its market cap has been actively traded. This resulted in a substantial traded value of $709.763 Million. Additionally, 97% of Near Protocol’s maximum supply was circulated in the market.
Over the past year, the NEAR price has witnessed a considerable surge, advancing by 360%. In just the last 24 hours, the market cap experienced a notable 5.2% increase. It signaled positive momentum in the token’s valuation.
An increase in trading activity further supported this growth. It was followed by the NEAR token’s traded volume surging by 33%.
The token’s Total Value Locked has also shown promising growth, with a noticeable uptick starting from mid-year. When writing, the TVL stood at $246.58 Million. It indicated increasing investor confidence and a growing use case for the protocol.
Short Liquidations in the Near Protocol Token Surpass A Million
A close analysis of NEAR Crypto’s liquidation chart revealed a significant rise in short liquidations. This highlighted the recent dominance of bullish sentiment.
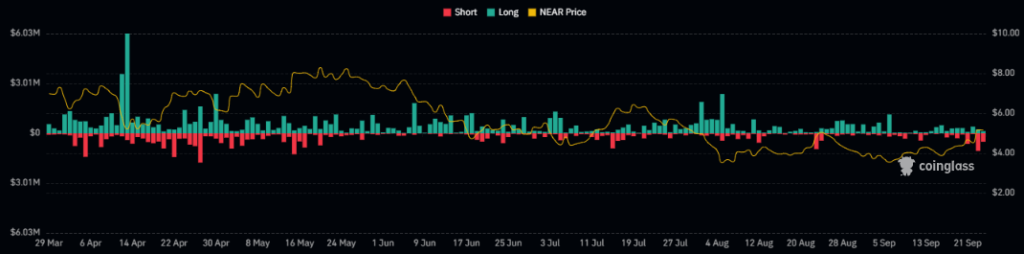
In the past 24 hours, the short liquidation value has more than doubled that of long liquidations, amounting to $1.19 Million. This indicated that traders betting against the token have been caught in a squeeze. It further strengthened the bullish momentum.
Additionally, open interest in Near Protocol has surged by 19.1% within the same 24-hour period. It brought the total value of open positions to $276.04 Million. This increase reflected growing interest and activity in the token’s derivatives market.
Furthermore, the derivatives trading volume for the NEAR token has spiked by an impressive 73% over the last day. It reached the traded value of $1.11 Billion.
This surge in trading activity underscored the growing engagement of traders with Near Protocol’s futures and options markets. It fueled the token’s ongoing market strength.
A Strong Bullish Candle Is Formed On NEAR Daily Chart
The NEAR crypto price traded in a strong downtrend for more than four months, followed by strong profit booking. Before this declining trend, the price was in a strong uptrend and advanced by over 700% in just a few months.
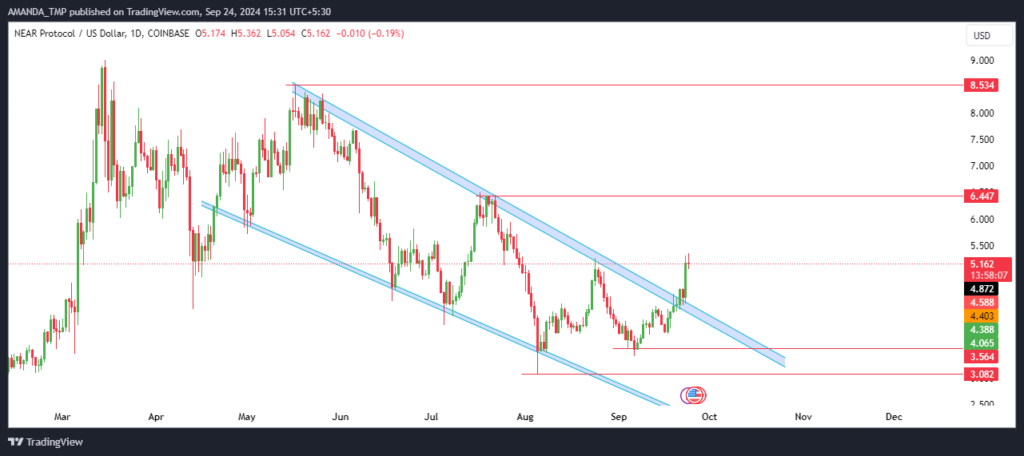
On March 15, 2024, the NEAR token price formed a swing high of $9.0. Since then, it never broke the following level.
The token price started to witness profit booking. This led to the formation of a falling wedge pattern on the daily chart. Moreover, if we look into the most recent price action, the NEAR price broke above the wedge pattern.
The breakout in price was followed by a strong momentum and volume surge in token. This exhibited strong support of buyers in the token price, followed by optimism among investors for the token.
What’s Going On With NEAR Token’s Technicals?
The 20-day and the 50-day EMAs at press time overlapped each other on the daily chart. This was followed by the price trading above the 200-day EMA and other lower-valued EMAs. It showed strong bullish behavior in the NEAR crypto price.
NEAR/USD TradingView.com
MACD and the signal line following a bullish momentum in price advanced to the bullish trajectory. The following metrics further traded in a golden cross.
The RSI also hit the overbought zone and traded at a level of 68.4 at press time. This was followed by a breakout above the 14-day SMA and RSI sustaining above the 50-level.
The NEAR price might take support at $3.0 and $3.5, following the resistances of $6.50 and $8.50.
Disclaimer
This article is for informational purposes only and does not provide any financial, investment, or other advice. The author or any people mentioned in this article are not responsible for any financial loss that may occur from investing in or trading. Please do your research before making any financial decisions.




