
 Dacity Coin
 Pearl
Pearl Bitcoin
 Sui
Sui Quantus
 Injective
 Zcash
Zcash
- Kaspa price has declined by 14% in less than 2 days.
- The trading volume has dropped by 42% to $165.54 Million.
At the beginning of November, the Kaspa (KAS) price picked up bullish momentum from the demand zone of $0.100. However, the bullish momentum was interrupted near the 200-day EMA and witnessed selling pressure. KAS price has melted to the 20-day EMA and has triggered a negative pullback.
By analyzing the technical chart, the Kaspa crypto price has not performed well as compared to the other altcoins. This demonstrates that sellers were strong and any bearish signal could trigger bearish momentum.
RSI and Bollinger Band Analysis
Before reversing course and returning to the upper Bollinger Band, Kaspa’s price surged to $0.14697. The subsequent reversal pattern indicates that sellers are active and pushing the price lower, which may indicate a phase of consolidation.
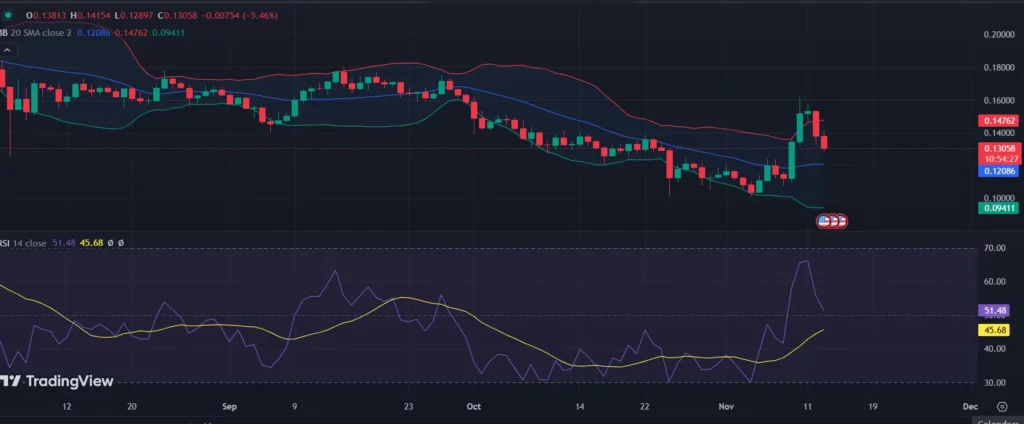
With the Relative Strength Index (RSI) at 54.46 right now, the momentum state is confirmed to be neither overbought nor oversold.
RSI indicates a drop in buying pressure compared to preceding trading sessions. Although recent performance suggests consolidation or a short-term bearish outlook, the RSI’s neutral stance leaves open the possibility of a rise or a fall.
Bullish Technical Indicators and Market Trend
The analyst also points out a bullish crossover in the MACD for the Kaspa token. Here the green histogram bars indicate increasing buying momentum and the MACD line moves above the signal line.
The current trend in Kaspa’s price is supported by this positive signal and increased trading volumes, which indicate buying pressure.
The volume spike validates a price rise scenario and invalidates abrupt reversals. Kaspa’s price prediction is also supported by the larger cryptocurrency market, as sentiment toward altcoins is elevated by Bitcoin‘s strength at around $87,500. Kaspa is likely to gain more traction amid Bitcoin’s latest post-$90K ATH run.
Technical Analysis of Kaspa Price Over 1-D Timeframe
The chart that analyst dark_knight_btc highlighted the 0.786 Fibonacci retracement level, which is located around $0.10483. This is also where many technical analysts anticipate a reversal.
$KAS | $USDT | @KaspaCurrency | 1D Update$KAS has shown impressive resilience, bouncing strongly from the 0.786 Fibonacci retracement level, a key zone often viewed as optimal for price recovery.
— Dark Knight (@dark_knight_btc) November 12, 2024
The bullish MACD and increasing buyer volume suggest solid momentum that could… pic.twitter.com/VubXRHKv82
Buyers are supporting the price in this zone, which may also be a bullish area, as indicated by the strong bounce back from this level. Kaspa might be signaling the start of a fresh upward trend if it sustains above this level.
According to his chart, Kaspa is trading near the 50-day Simple Moving Average (SMA) and the 0.5 Fibonacci retracement level of $0.14314.
The Support/Resistance (S/R) flip, which is a strong level of support or resistance created by this convergence, may be crucial in determining the future course of prices. The higher Fibonacci retracement levels provide a target higher up to the Kaspa price if the price is able to break above this level for a prolonged amount of time.
The analyst finds additional resistance levels at the 0.382 level of $0.15894 and the 0.236 level of $0.17852 in addition to 0.5 for $0.14214. Kaspa could reach its previous all-time high ATH at $0.20987 if it breaks out of these levels.
Disclaimer
In this article, the views, and opinions stated by the author, or any people named are for informational purposes only, and they don’t establish the investment, financial, or any other advice. Trading or investing in cryptocurrency assets comes with a risk of financial loss.




