
 Injective
 Celestia
 streamoors
 Sui
Sui Pudgy Penguins
 Bitcoin
 Pearl
Pearl
- APT price reached the November resistance level and formed a strong bearish candlestick.
- Growing demand is indicated by APT funding and open interest rates.
- Stablecoin market cap and Aptos TVL have reached new heights.
Aptos (APT) price has departed from the base zone of $5 and has gained more than 100% till now. In November, the APT price performed positively; it tested the $14 mark in a single move. However, a selling move was observed near this zone but buyers were still there and lifted the price again.
Aptos price has received strong selling pressure near the major resistance level of $14 and has lost 8.32% in a few hours. However, it is defending the 20-day EMA, reflecting a strong bull grip.
APT Price Technical Analysis Over 1-D Timeframe
When writing, Aptos crypto was trading at $12.58, after a 6.61% intraday. The market capitalization was $6.69 Billion and the 24-hour trading volume was $508.10 Million.
The technical chart displays that the second attempt to exceed the $14 mark failed. This could bring bearish momentum ahead. Here, the 20-day EMA could play a vital role as a support level.
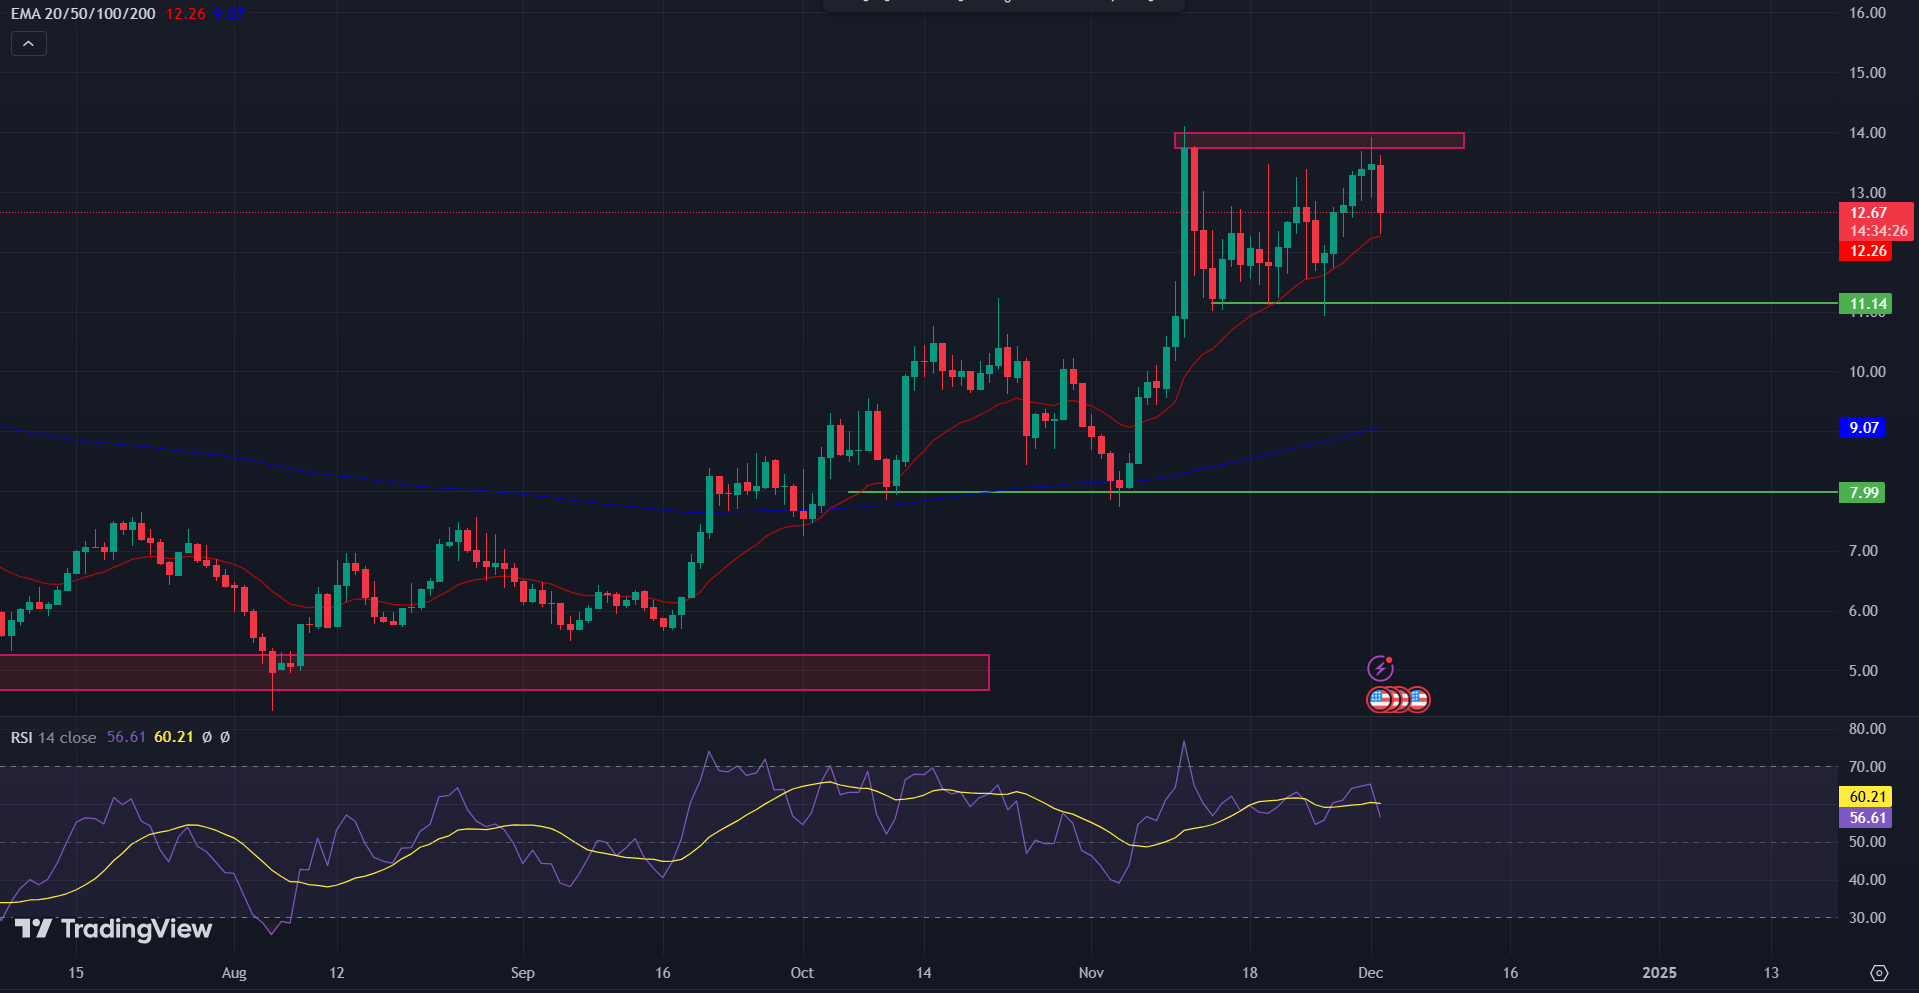
Once the price loses the 20-day EMA, it could generate a bearish signal. In this situation, most traders and investors might prefer to book profit which could result in a bearish move. If the price starts trading below the $11 level, massive selling pressure is likely.
Alternatively, buyers could gain confidence if the price bounces back and exceeds the $14 mark. A bullish rally is highly likely once the price holds over the $14 level. Aptos price has the potential to reclaim the $20 mark amid this bull run.
According to the technical indicators, the RSI has generated a death crossover with the RSI-based moving average. A bearish crossover with the MACD and the Signal line was detected and the histograms flipped to red. Most of the technical indicators were in favor of a bearish trend.
Open Interest and Funding Rates in APT Increased; What’s Next?
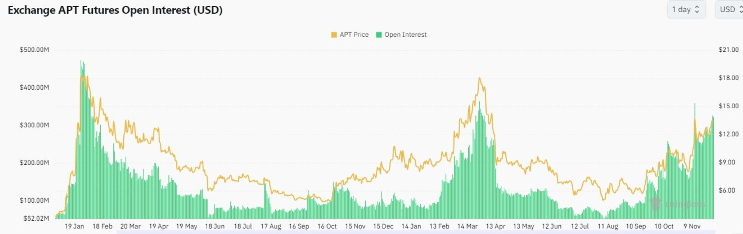
Over the past ten days, Aptos’ open interest has increased in tandem with the recent recovery in demand. After falling as low as $249 Million on November 19, it reached a peak of $322.45 Million yesterday.
A robust increase in positive funding rates supported the growing open interest, reflecting the recovery in demand.
Notably, there was less open interest than on November 12. This implies that at the time of writing, the momentum build-up was sufficiently strong to result in a breakthrough. However, this might alter based on the state of the market.
Spot flows showed that on November 30, there were a lot of outflows. Although much less than the day before, the cryptocurrency had net negative flows over the last 24 hours at the time of observation.
The market could see large long liquidations in case of unanticipated bearish retracement. According to Coinglass, APT long liquidations in the last 24 hours amounted to $672,210. This is significantly greater than the $190,430 from short liquidations.
Aptos Price Analysis and Forecast
Aptos crypto is currently facing a pivotal moment as it tests the $14 resistance level. Despite a recent bullish performance that saw the price surge over 100%, selling pressure has emerged at this critical point.
The failure of the price to break above $14 in two attempts raises concerns about potential bearish momentum.
The 20-day EMA is an essential support level; if the price falls below this, it may trigger profit-taking among traders, leading to further declines. Conversely, a successful breakout above $14 could reignite buyer confidence and pave the way for a bullish rally, with the potential to reach the $20 mark.
Technical indicators indicate a bearish sentiment, featuring a death crossover in the RSI and negative signals from MACD.
Disclaimer
This article is for informational purposes only and provides no financial, investment, or other advice. The author or any people mentioned in this article are not responsible for any financial loss that may occur from investing in or trading. Please do your research before making any financial decisions.




