
 Zerebro
 Bitcoin
 Quantus
 Pearl
Pearl Starknet
 ZKsync
 NEAR Protocol
- Solana’s crypto price breached the $200 support zone amid the selloff.
- Solana network transactions noted a surge, close to 67 Million.
Solana (SOL) has experienced significant declines recently and breached the $200 support zone. However, during this period, the Solana crypto saw a notable surge in network transactions.
Approximately 60 million transactions were made per day on the Solana network last month. The daily transactions, meanwhile, increased by about 70 million earlier this week.
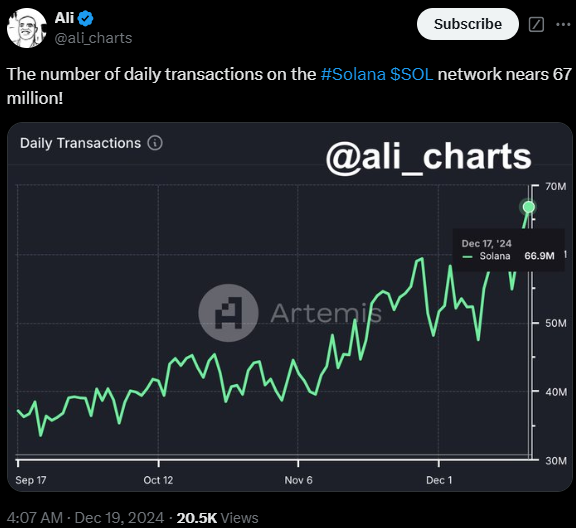
It was not a record-breaking rise in daily transactions on the Solana network. However, it was an interesting one. Per DeFiLlama, on August 30, 2023, the coin saw a record transaction of 376 million.
When writing, the SOL price was $190.92, indicating an intraday drop of more than 9.20%. As a result, the selling spree was repeated. It now has a $91.35 Billion market capitalization, while its total supply is $92.33 Billion.
How is Solana’s user growth powering SOL’s market performance?
Solana was the most used blockchain network in November. Solana crypto was mentioned by 53% of all global crypto users by November 2024 by TokenTerminal. This implied that the network benefited most from the utility of blockchains.
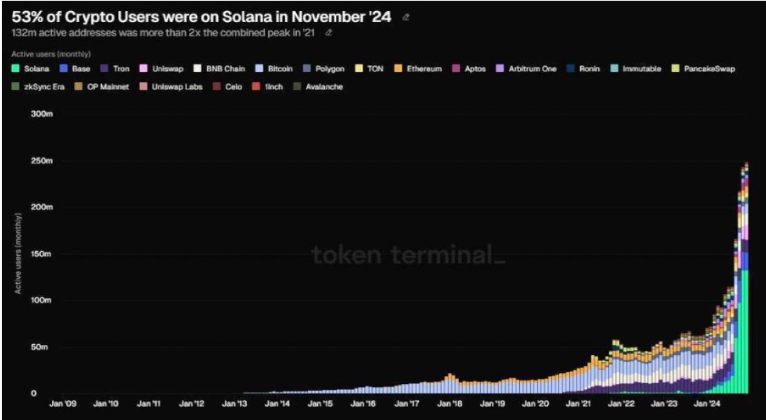
This was particularly significant as it points to a high level of market saturation of the firm’s products within the country. It also suggested that Solana user growth was skyrocketing in November. On top of the growth, it attained in the early months of the year.
The highest number of daily active addresses recorded was 6,630,000, which was recorded on 22 November. This has reduced significantly more than what was observed earlier. As of 18 December, it stood at 4.91 million active addresses.
The decrease in daily active addresses is evidenced by a certain slowing down in December. The next significant market shift may result in the creation of more addresses. Hence, it could increase latent organic demand for SOL.
Solana Price Prediction: Can Bulls Regain Strength?
Solana crypto has been experiencing a downtrend in recent days. Over the past seven days, the SOL price has corrected more than 20%. However, it has retested the 100-day EMA mark and could see a rebound in the coming sessions.
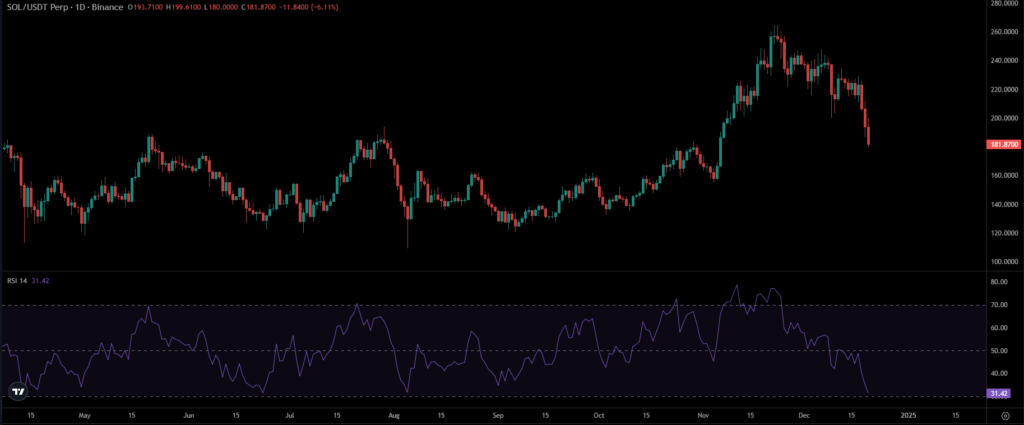
The Relative Strength Index (RSI) line dragged below the midline region. That conveyed signs of underperformance for the past few sessions. Despite the selling pressure, Solana’s long-term uptrend remained intact.
Once the Solana crypto price recovers above the $200 mark, it could continue to trade within the uptrend. Furthermore, it may reach the $250 mark in the coming weeks.
What Does Derivatives Data Suggest?
Data from Coinglass replicated that Solana crypto’s Open Interest (OI) has declined more than 8% to $4.81 Billion. This represented signs of long unwinding activity.
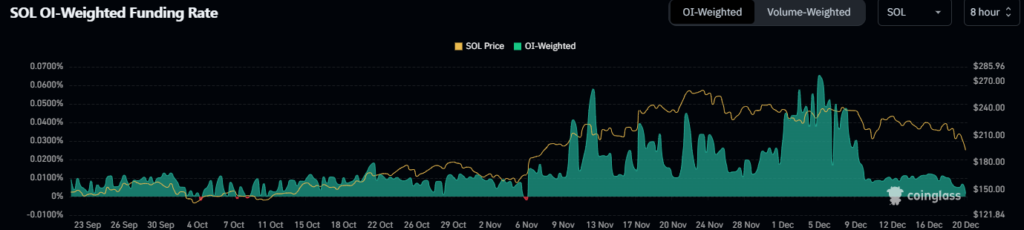
However, the funding rate remained positive at 0.0067%, revealing steady demand for long contracts. The immediate support zones for the SOL price were $184 and $175. At the same time, the resistance zones were $200 and $210.
Disclaimer
This article is for informational purposes only and provides no financial, investment, or other advice. The author or any people mentioned in this article are not responsible for any financial loss that may occur from investing in or trading. Please do your research before making any financial decisions.




