
 NEAR Protocol
 Bitcoin
 Aerodrome Finance
 Pearl
Pearl Uniswap
 Quantus
 Pudgy Penguins
- LTC’s active addresses noted a surge, replicating growing investor confidence.
- Litecoin crypto takes a breather and eyes to reclaim the $100 mark.
Litecoin (LTC) crypto has recently witnessed significant downward pressure and breached the $100 support mark. The Litecoin price has dropped 2.01% in the last 24 hours, trading at $98.01.
Over the last seven days, the LTC price has declined by 7.90%. This price decline has also resulted in a 7.12% drop in market value to $7.40 Billion.
Despite the bearish Litecoin price movement, analysis from on-chain metrics suggested a reversal and a potential upsurge in the coming days. Continue to read on for further insights.
Growing Addresses Point to Rising Market Interest
Despite the significant downward price movement, LTC’s on-chain metrics showed increased market interest.
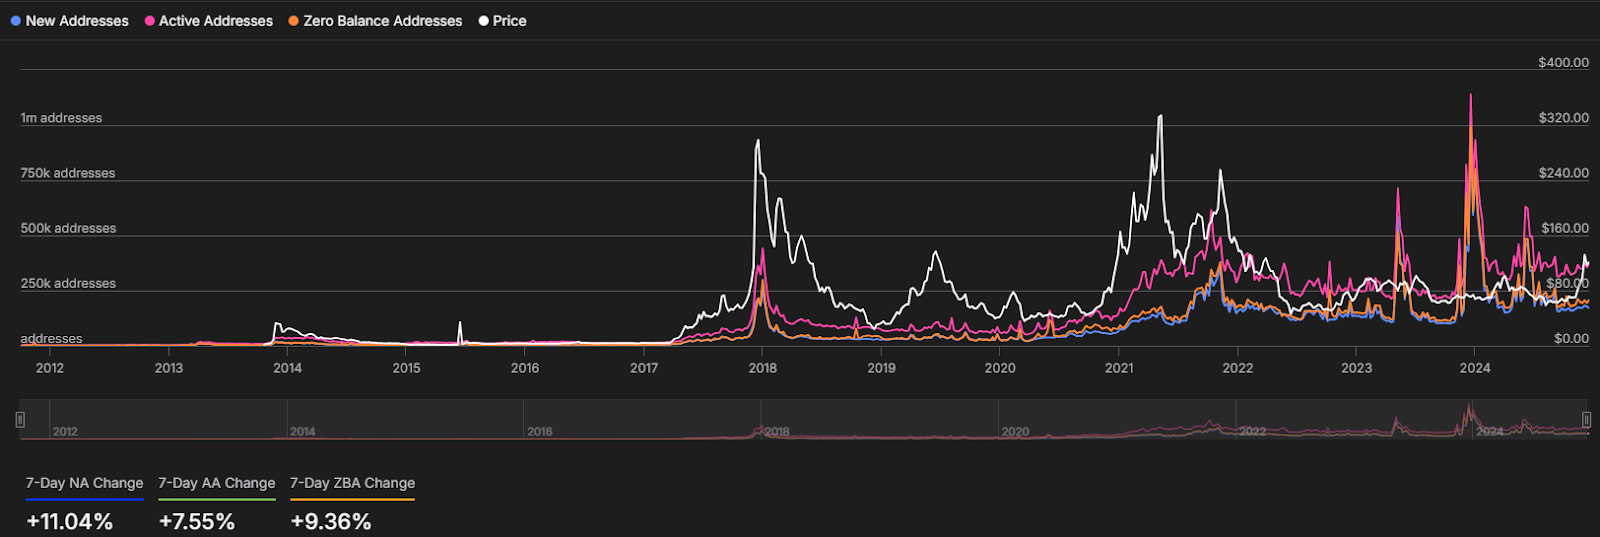
Data from IntotheBlock shows that LTC’s new addresses have surged by over 11.04%. Moreover, active addresses have surged by over 7.55%. This suggested the growing adoption of Litecoin. That could drive the trend reversal ahead in the price of Litecoin.
Moreover, the large holders or whales activity also signaled the same. This happened as large transaction activity noted a rise of over 3.20% in the last 24 hours.
This combination of heightened market participation and the influx of new addresses could ease selling pressure. Furthermore, it may lead to retaining the $110 mark in the coming days.
Litecoin Price May Surge to $170: Analyst Weigh In
A recent tweet by Rose Premium Signals highlighted a bullish bias on the Litecoin price. According to the analyst, the LTC price has been consolidating within a downward channel and respecting the Fib levels.
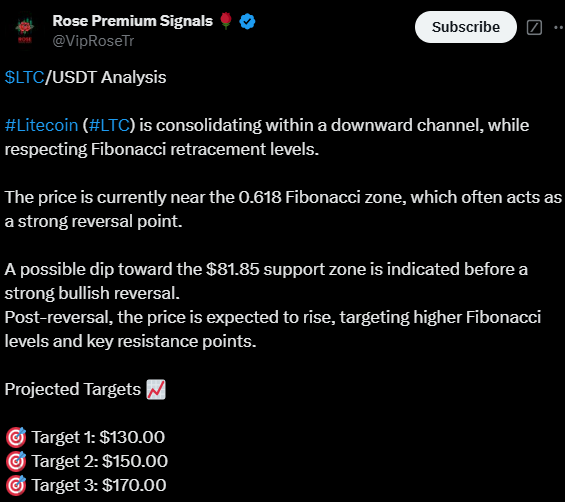
The Litecoin price has taken support around the 61.8% Fibonacci support level. In case of a rebound from there, it may see a reversal toward $130, followed by $150. At the same time, a break above the $150 mark could stretch the gains toward $170 in the short term.
Litecoin Price Prediction: What Do Charts Say?
Since the beginning of this month, the Litecoin price has been draining gains and moved within a downward channel. It has formed lower highs and lower lows. Furthermore, the token has fallen below the 50-day EMA mark, guiding sellers’ dominance in the past two weeks.
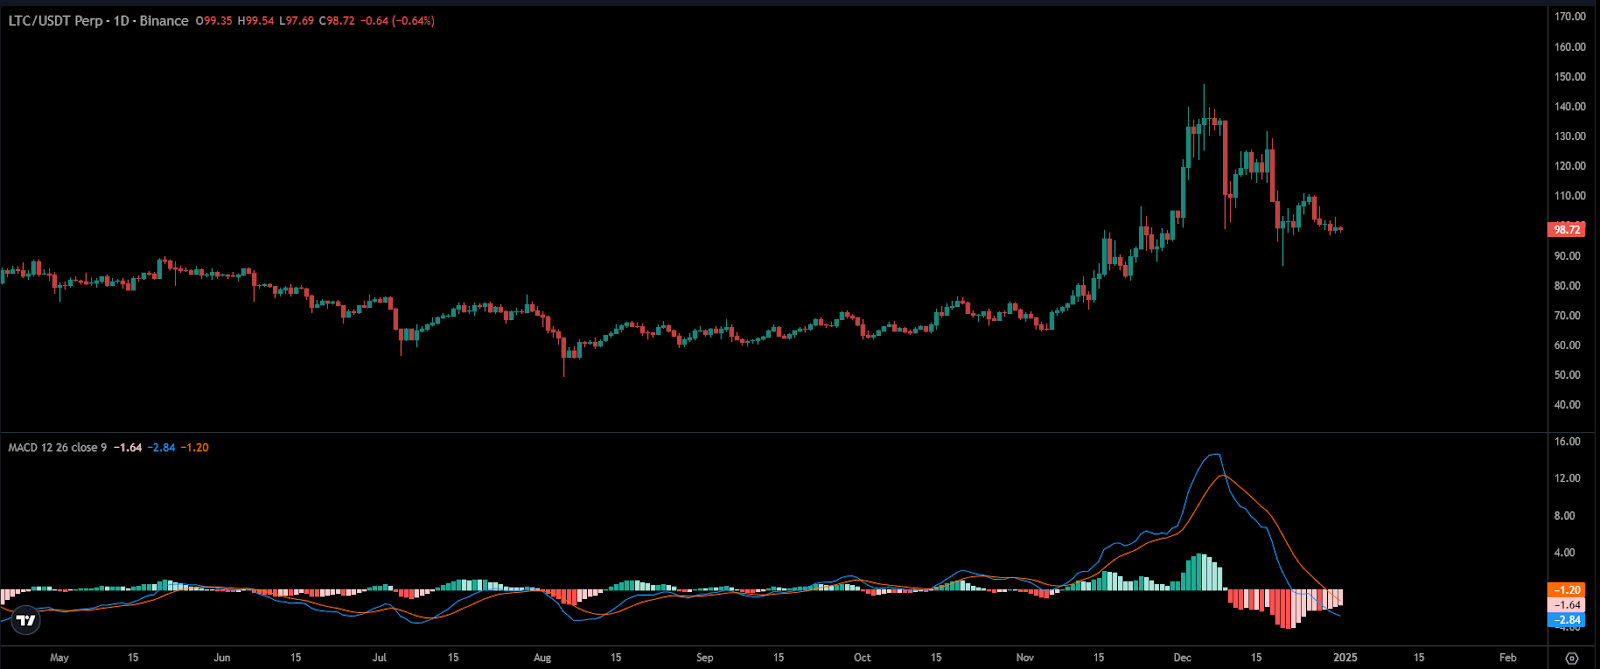
Following a rejection from the $146 mark, the LTC price failed to regain thrust and has faced profit booking from the highs. However, the $100 round mark previously acted as a demand zone. Also, the upcoming sessions can anticipate a noteworthy retest toward $120.
The MACD indicator still signals bearishness as the Litecoin price is still consolidating below the 50-day EMA mark. Once it aggressively surpasses the $105 mark, a bullish crossover followed by a reversal could be seen.
LTC’s Supply Shrinks: What’s Driving the Trend?
Data from Coinglass showed that LTC’s available supply has been continuously decreasing. With this, the exchange net outflows dropped significantly.
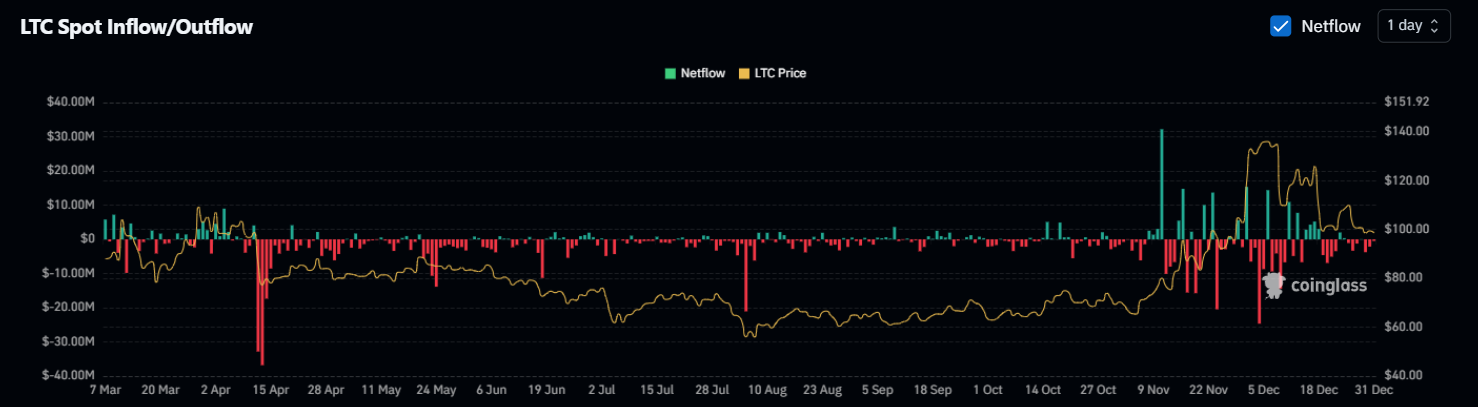
In the last 48 hours, $5.60 Million worth of LTC was withdrawn from exchanges. This brought its weekly net outflow to $7.80 Million.
At the same time, the OI-weighted funding rate remained positive at 0.0108%. This signaled a steady demand for long contracts. The immediate support zones for Litecoin price were $95 and $90. At the same time, the upside hurdles were $102 and $110.
Disclaimer
In this article, the views, and opinions stated by the author, or any people named are for informational purposes only, and they don’t establish the investment, financial, or any other advice. Trading or investing in cryptocurrency assets comes with a risk of financial loss.




